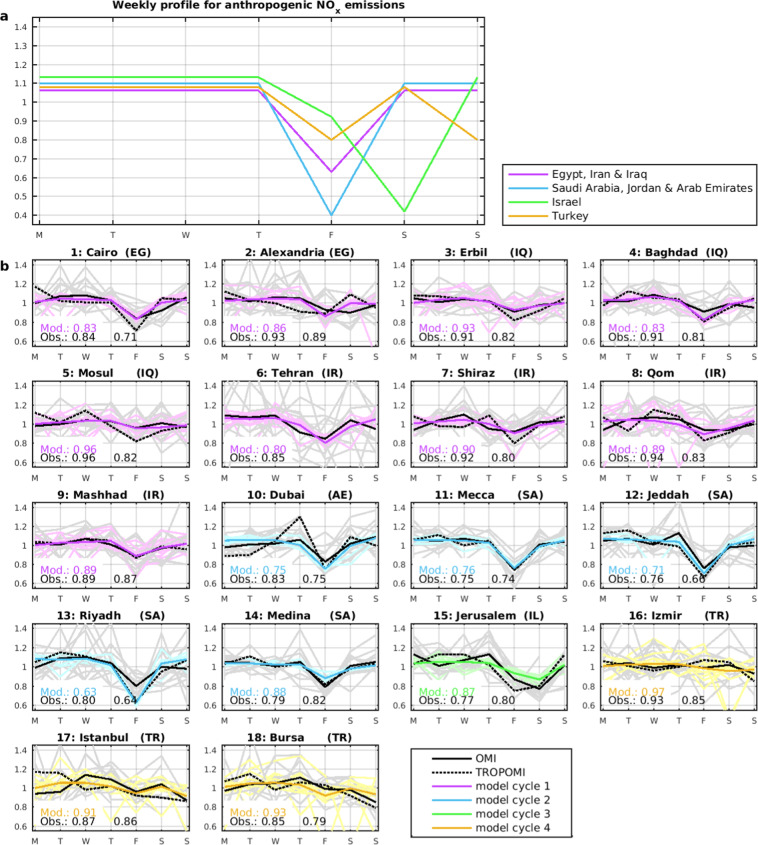
Figure 6.
(a) Normalised weekly profiles of anthropogenic NOx emissions for Middle East countries used in the simulations (see main text). (b) Mean normalised weekly NO2 cycle in Middle East cities observed by OMI (black), TROPOMI (dashed black) and predicted by the model (coloured lines). The model uses distinct weekly emission profiles for Egypt, Iran and Iraq (magenta), Arab Emirates, Jordan, and Saudi Arabia (blue), Israel (green), and Turkey (yellow). Thick black line: average OMI 2005–2017; thin grey lines: individual years. The day-of-minimum normalised column is given inset for the model, OMI, and TROPOMI.

