Figure 3.
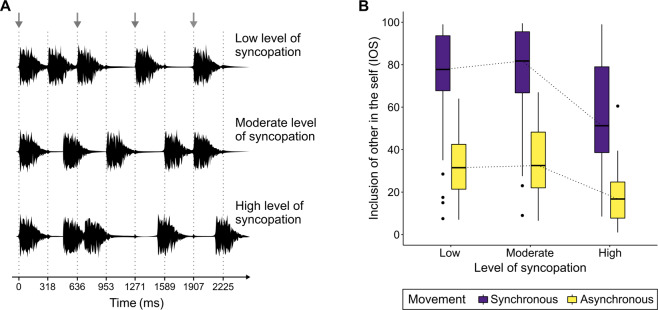
Stimuli and results of Study 3. (A) Waveforms of one bar of the three different musical stimuli with low, moderate, and high levels of syncopation. The dotted grey lines represent the eighth-note level at a tempo of 94.4 beats per minute. The grey arrows on top mark the strong metric positions at the quarter-note (beat) level. In the stimulus with low syncopation, four of five piano chord onsets fall on the strong metric positions, compared to two in the moderately syncopated and one in the highly syncopated stimulus. The smaller peaks represent a soft hi-hat sound, which was marking the eighth notes. (B) inclusion of other in the self ratings for videos with synchronously or asynchronously moving figures accompanied by musical stimuli with three different levels of rhythmic complexity (low, moderate, and high levels of syncopation). Boxes represent the interquartile range (IQR); whiskers represent the lowest values within 1.5 * IQR of the lower quartile, and the highest values within 1.5 * IQR of the upper quartile; dots represent outliers; dotted lines represent the connections between the medians (center line).

