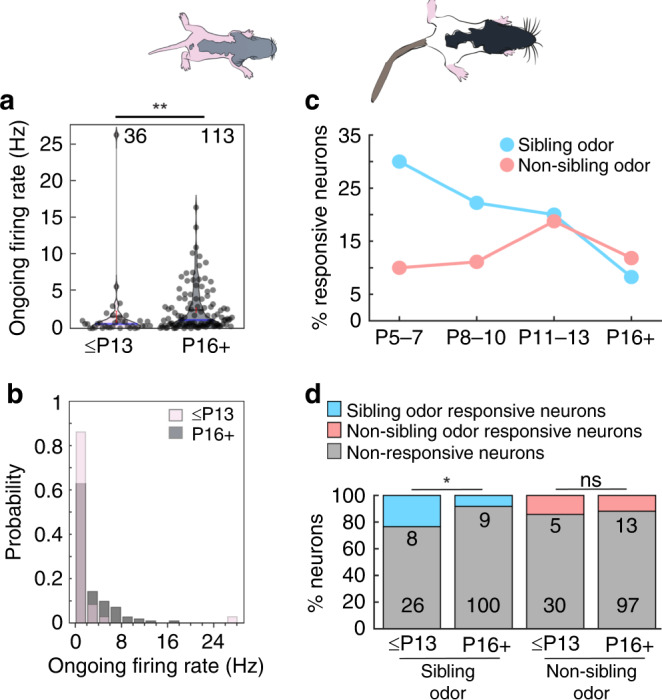
Fig. 7. Development of ongoing firing and kin-odor-responsive neurons in the lateral septum.

a Ongoing firing rate was lower in young vs. old pups (≤P13: n = 36; median = 0.59 Hz; mean ± s.e.m. = 1.59 ± 0.73 Hz; P16+: n = 113; median = 1.12; mean ± s.e.m. = 2.46 ± 0.29 Hz; difference of medians = 0.53 Hz; p = 0.004, Mann-Whitney rank sum test). Horizontal blue line is the median, horizontal black line is the mean. Error bars are s.e.m. b Probability histogram of ongoing firing rates (bins range from 0 to 30 in 2 Hz increments). c Percentage of significantly suprathreshold responsive neurons with developmental age. As previously described, significance for stimuli was analyzed when number of trials was ≥3. Sibling odor significant neurons (n = responsive:total neurons; P5–7 = 3:10 neurons, P8–10 = 2:9 neurons, P11–13 = 3:15 neurons, P16+ = 9:109 neurons). Non-sibling odor significant neurons (n = responsive:total neurons; P5–7 = 1:10 neurons, P8–10 = 1:9 neurons, P11–13 = 3:16 neurons, P16+ = 13:110 neurons). d Proportion of suprathreshold odor significant and odor non-significant neurons for sibling odors and non-sibling odors in sibling-preferring and sibling-avoiding age groups. ≤P13 (sibling odor: 8 significant, 26 non-significant; non-sibling odor: 5 significant, 30 non-significant), P16+ (sibling odor: 9 significant, 100 non-significant; non-sibling odor: 13 significant, 97 non-significant). Proportion of sibling odor-responsive neurons was different between age groups (≤P13 vs. P16+ sibling odor responsive; p = 0.029, Fisher’s exact test) and not different for proportion of non-sibling-responsive neurons (≤P13 vs. P16+ non-sibling odor responsive; p = 0.77, Fisher’s exact test). Colored bars represent proportion of significantly responsive sibling or non-sibling neurons. Gray areas indicate proportion of neurons which were not significantly responsive. All tests are two-tailed. For detailed statistical information, see Supplementary Table 1. *p < 0.05, **p < 0.01, ns not significant.
