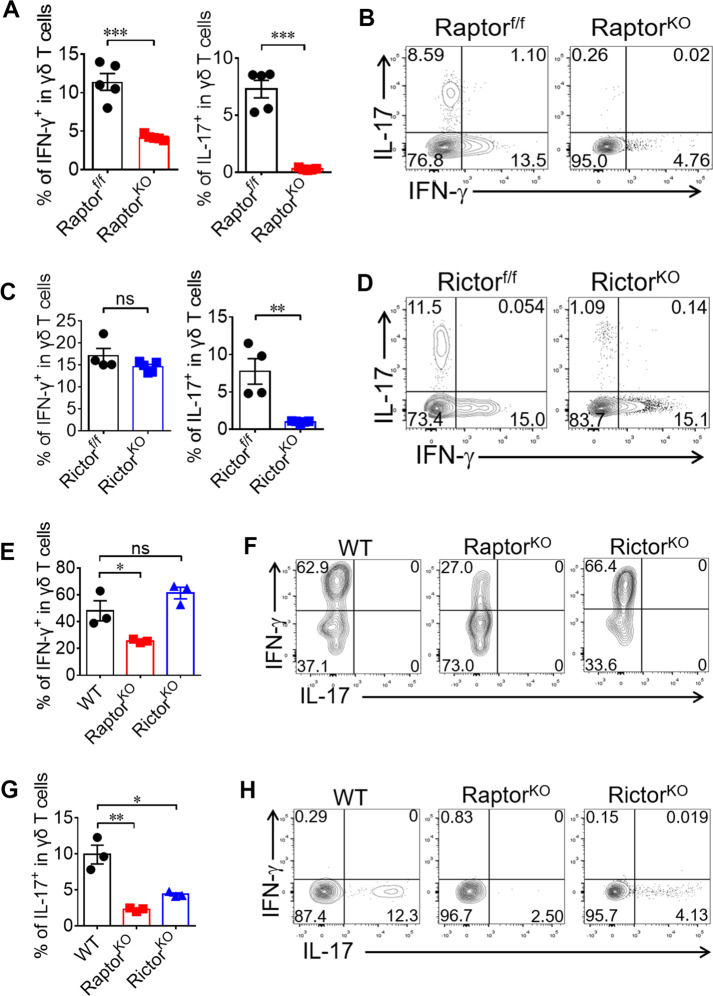
Fig. 2. mTORC1 impacts both γδ T1 and γδ T17 differentiation, but mTORC2 impacts only γδ T17-differentiation.
a, b Raptor-f/f and Raptor KO mice were sacrificed and γδ T cells were analyzed for IL-17 and IFN-γ expression in spleen ex vivo. Each symbol represents an individual mouse, statistics of 5 mice for each group shown in (a). Representative plots were shown in (b). c, d Rictor-f/f and Rictor KO mice were analyzed as in (a) and statistics of 4–5 mice for each group was shown in (c) and representative plots were shown in (d). e–h Naïve γδ T cells were sorted from pooled splenocytes of WT (n = 15), Raptor KO (n = 17) or Rictor KO (n = 14) mice and cultured under γδ T1 (e, f) or γδ T17 (g, h) -skewing conditions. At day 4, cells were collected for IFN-γ / IL-17 staining. Statistics for triplicates was shown in (e, g) and representative results in (f, h). Data are means ± SEM. ns, not significant; *P < 0.05, **P < 0.01 and ***P < 0.001 (two-tailed unpaired t test). Data are representative of at least three independent experiments. Numbers indicate percentage of cells in quadrants.

