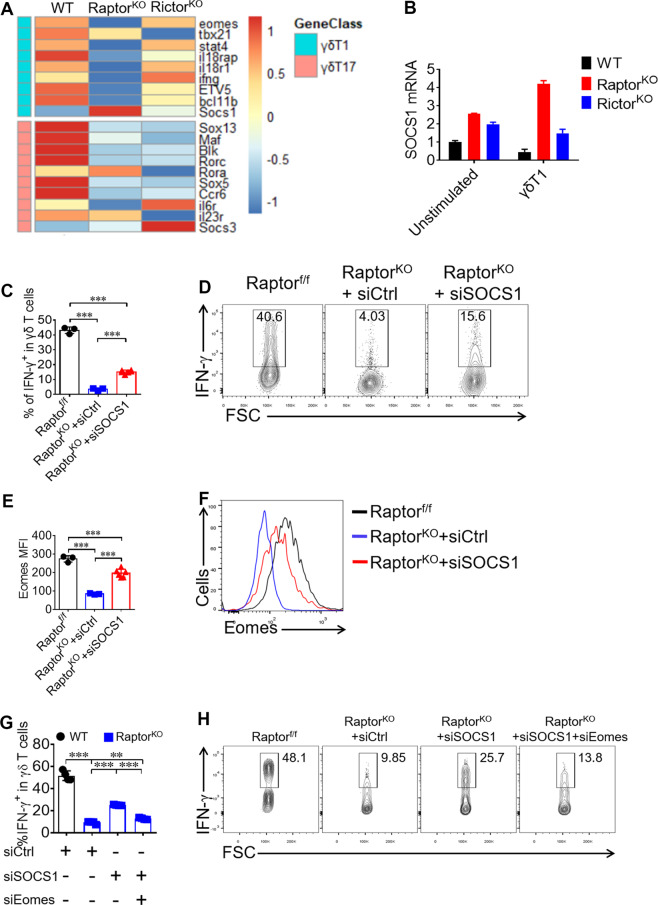
Fig. 4. mTORC1 signaling promotes Eomes expression through inhibiting SOCS1 expression in γδ T cells.
a RNAseq heat map of differentially expressed genes in samples of WT (n = 6), Raptor KO (n = 8 mice per sample) and Rictor KO (n = 5 mice per sample) γδ T cells isolated from pooled spleen. Expression of signature genes for γδ T1 and γδ T17 were shown. b SOCS1 mRNA were analyzed by real-time quantitative PCR in WT, Raptor KO and Rictor KO γδ T cells left unstimulated or priming under γδ T1 condition for 72 h. c, d Under the γδ T1 condition, γδ T cells were transfected with SOCS1 siRNA and cells were analyzed at day 4 for IFN-γ staining. Statistics of 3–6 replicates was shown in (c). Representative FACS plots were shown in (d). e, f Eomes was stained for γδ T cells at day 4 of γδ T1 condition and the MFI of Eomes for 3–6 replicates and statistics was shown in (e) and representative Eomes staining histograms was shown in (f). g, h Under the γδ T1 condition, Raptor KO γδ T cells were transfected with SOCS1 and Eomes siRNA and cells were analyzed at day 4 for IFN-γ staining. Statistics of four replicates was shown in (g). Representative FACS plots were shown in (h). Data are means ± SEM. ns, not significant; ***P < 0.001 (two-tailed unpaired t test). Data are representative of at least three independent experiments. Numbers indicate percentage of cells in gates.

