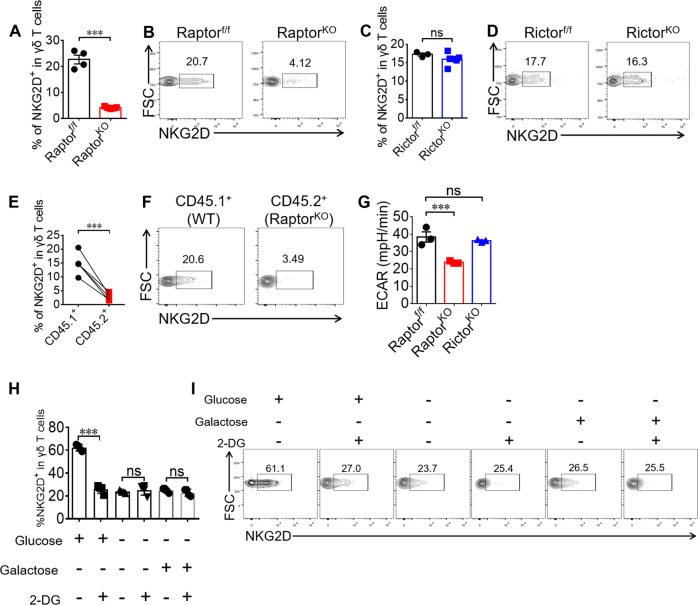
Fig. 5. mTORC1-mediated glycolysis is required for NKG2D expression on γδ T cells.
a, b Raptor-f/f and Raptor KO mice were sacrificed and γδ T cells were analyzed for NKG2D expression in spleen ex vivo. Each symbol represents an individual mouse. Statistics of 4–5 mice was shown in (a) and representative plots were shown in (b). c, d Rictor-f/f and Rictor KO mice were sacrificed and γδ T cells were analyzed for NKG2D expression in spleen ex vivo. Each symbol represents an individual mouse. Statistics of 3–6 mice was shown in (c) and representative plots were shown in (d). e, f γδ T cell NKG2D expression was analyzed for mice in Fig. 1 (p–r). Each symbol represents an individual mouse. Statistics of five mice for each group was shown in (e) and representative plots were shown in (f). g WT, Raptor KO and Rictor KO γδ T cells were expanded for 6 days and analyzed by seahorse metabolism analyzer. Statistics of triplicates of ECAR was shown in (g). h, i γδ T cells isolated from WT mice and stimulated with anti-γδ TCR and anti-CD28 condition with or without 2-DG (1 mM) in the indicated glucose (10 mM) or not or galactose (10 mM) for the first 96 h. Cells were collected and NKG2D was stained and representative plots were shown. Data are means ± SEM. ns, not significant; ***P < 0.001 (two-tailed unpaired t test). Data are representative of at least three independent experiments. Numbers indicate percentage of cells in gates.

