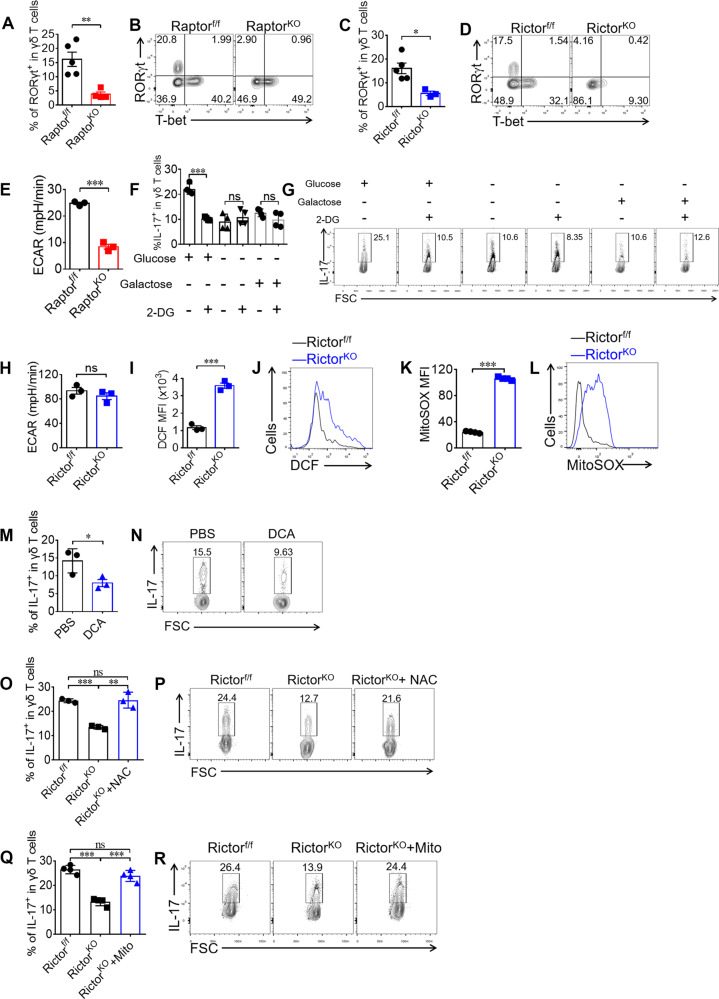
Fig. 7. Both mTORC1 and mTORC2 are required for γδ T17 differentiation through different mechanisms.
a, b Raptor-f/f and Raptor KO mice were analyzed for γδ T cell RORγt / T-bet expression in spleen ex vivo. Each symbol represents an individual mouse. Statistics of 4–5 mice for each group was shown in (a) and representative plots were shown in (b). c, d γδ T cell RORγt and T-bet was stained for Rictor-f/f and Rictor KO mice in spleen ex vivo. Statistics of 3–5 mice for each group shown in (c) and representative plots were shown in (d). e Raptor-f/f or Raptor KO mice γδ T cells were isolated and cultured under γδ T17-skewing conditions for 5 days. Differentiated γδ T cells were analyzed by seahorse metabolism analyzer. Statistics of triplicates of ECAR was shown in (e). f, g Sorted WT γδ T cells were primed under γδ T17 condition with or without 2-deoxyglucose (2-DG) (1 mM) in the indicated glucose (10 mM) or not or galactose (10 mM) for 4 days. Cells were analyzed for IL-17 expression. h Rictor-f/f or Rictor KO γδ T cells were isolated and cultured under γδ T17 skewing conditions for 5 days. ECAR was analyzed by seahorse metabolisms analyzer. Statistics of triplicates was shown in (h). i, j Rictor-f/f or Rictor KO γδ T cells were incubated with 2′, 7′-Dichlorodihydrofluorescein diacetate (DCFH-DA) (5 μM) for 15 min at room temperature in the dark and then fluorescent 2′, 7′-dichlorofluorescein (DCF) was analyzed by FACS. Statistics of triplicates was shown in (i) and representative plots with MFI of DCF in each gate was shown in (j). k, l Rictor-f/f or Rictor KO γδ T cells were incubated with MitoSOX (5 μM) for 10 min at 37 °C in the dark and analyzed by FACS. Statistics of four duplicates were shown in (k) and representative plots with MFI of MitoSOX in each gate were shown in (l). m, n WT γδ T cells were sorted and primed under γδ T17 condition and dichloroacetate (DCA) (10 mM) was added to the culture. Cells were analyzed for IL-17 expression at day 4, with statistics of triplicates shown in (m) and representative plots were shown in (n). o, p γδ T cells from Rictor-f/f and Rictor KO mice were sorted and primed under γδ 17 condition and N-acetyl-L-cysteine (NAC) (1 mM) was added to the culture. At day 4, cells were collected and stained for IL-17. Statistics of triplicates were shown in (o) and representative plots were shown in (p). q, r γδ T cells from Rictor-f/f and Rictor KO mice were sorted and primed under γδ T17 condition and mito-tempo (Mito) (0.1 μM) was added to the culture. At day 4, cells were collected and stained for IL-17. Statistics of four duplicates were shown in (q) and representative plots were shown in (r). Data are means ± SEM. ns, not significant; *P < 0.05, **P < 0.01 and ***P < 0.001 (two-tailed unpaired t test). Numbers indicate percentage of cells in gates or quadrants.

