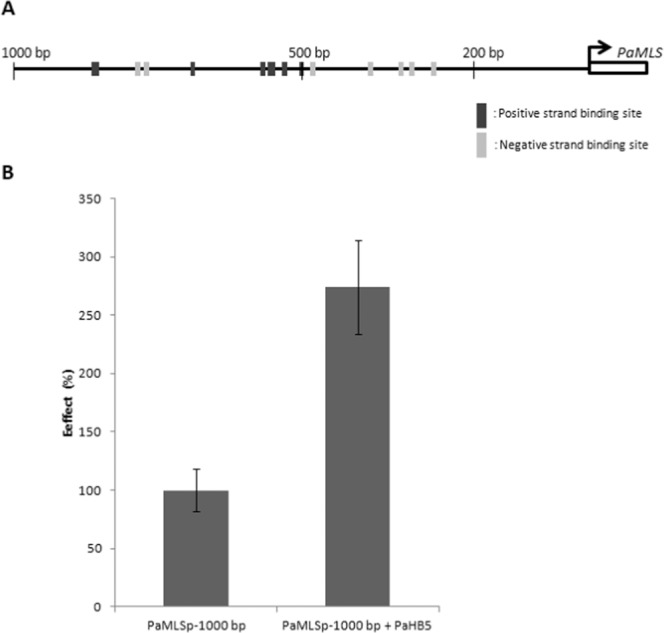
Figure 11.

Activation ability of PaHB5 on the PaMLS promoter. (A) Diagram of 1-kb PaMLS promoter. Numbers represent the distance in nucleotides from the 5′ end of the promoter to the start codon of PaMLS. The dark-grey and light-grey blocks on the promoter represent the putative binding sites of ATHB5 predicted by promoter analysis with PlantPAN. (B) Effect of PaHB5 on PaMLS promoter shown by relative luciferase activity of different treatments.
