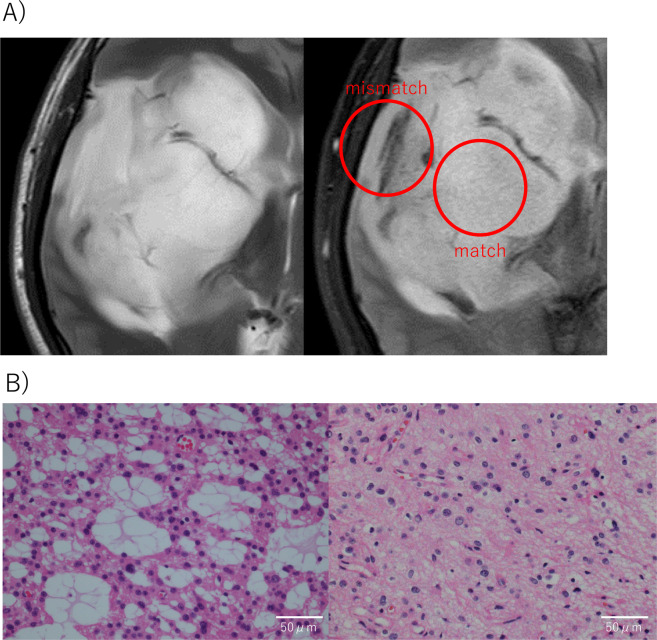
Figure 2.
Multi-sampling in a patient with IDH-mutant astrocytoma. (A) MR imaging. Left shows T2-weighted image and right shows FLAIR image. Red circles show T2-FLAIR matched and mismatched regions. (B) Hematoxylin–eosin (HE)-stained sections. Left shows HE staining of specimens from the T2-FLAIR mismatched region, where multiple microcysts were observed. Right shows HE staining of specimens from the T2-FLAIR matched region, where microcysts were hardly observed.

