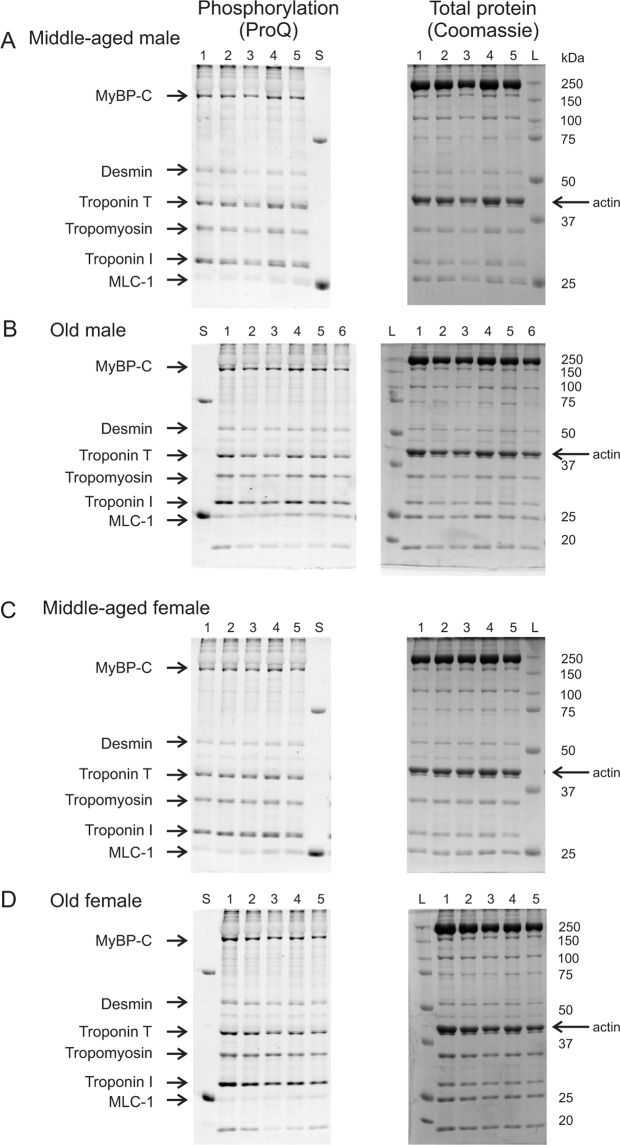
Figure 6.
Data illustrating the protein phosphorylation of major myofilament proteins in hearts from middle-aged and older males and females of both sexes. Gels illustrate phosphorylation staining (ProQ Diamond) and total protein staining (Coomassie blue) for all samples quantified in this study. Individual samples in each group are indicated numerically at the top of each lane. Protein standards at 25 and 75 kDa are visible in the ProQ images (lane labelled “S”) and the molecular weight ladder is visible in the Coomassie images (lane labelled “L”). Actin (42 kDa) was used as a loading control and is shown with an arrow on each Coomassie image. (A,B) Myofilament proteins from middle-aged and older male ventricles were separated on SDS-PAGE and stained with Pro-Q (left) to compare phosphorylation. They were also stained with Coomassie blue (right) to illustrate protein load. (C,D) Myofilament proteins from middle-aged and older females separated by Pro-Q (left) and stained with Coomassie (right). Major myofilament proteins are indicated on the left side of each panel and molecular weight markers (kDa) are shown on the right. Myosin-binding protein C (MyBP-C), myosin light chain-1 (MLC-1). The gels have been cropped to the edges; the uncropped gels are included as Supplementary Information Files 1–3. Samples were hearts from 5 middle-aged male mice, 6 older males, 5 middle-aged females and 5 older females, respectively.

