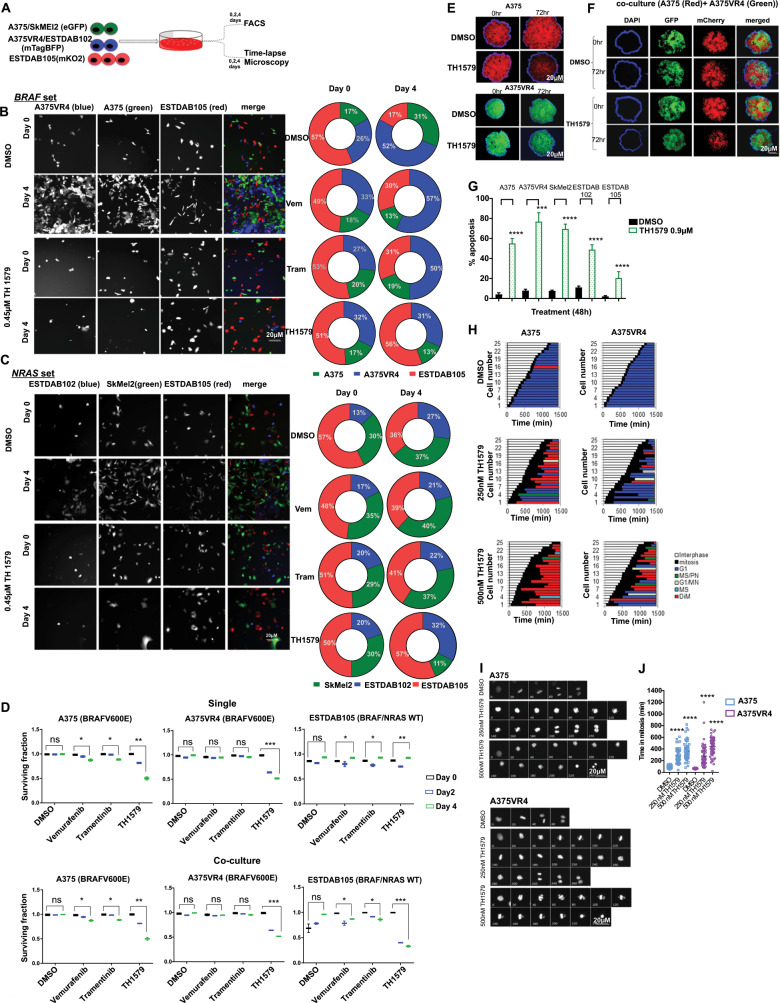
Fig. 2. TH1579 treatment causes prolonged time in mitosis and cell death in co-culture (NRAS and BRAF sets) as well as in 3D spheroid culture of CMM cells.
a Schematic illustration of single and co-culture experiments to compare drug sensitivity. Briefly, A375 and SkMEl2 cells were tagged with eGFP (green), A375VR4 and ESTDAB102 with mTagBFP (blue) and ESTDAB105 with mKO2 (red). Cells were then either single cultured or co-cultured as BRAF set (A375, A375VR4, and ESTDAB105) or NRAS set (SkMel2, ESTDAB102, and ESTDAB105) overnight before treatment with DMSO or BRAF inhibitor (Vemurafenib, Vem, 0.4 μM), MEK inhibitor (Trametinib, Tram, 3 nM), or MTH1 inhibitor (TH1579, 0.45 μM) for 4 days. Time-lapse microscopy was performed to detect changes in cell proliferation by measuring number of cells (DAPI count) followed by quantification using cell profiler software. The proportion of each CMM cell line (shown in b and c) was calculated as % of total number of cells day 0 (i.e., before treatment) and day 4 (i.e., following 4 days treatment), respectively. FACS was performed on day 0, 2, and 4 to measure fraction of apoptotic cells (measured as a ratio of number of labeled + AnnV + cells to total number of labeled + cells). b For the BRAF set, the BRAFi resistant A375VR4 cell approximately doubled its proportion after 4 days in control (DMSO), vemurafenib as well as trametinib treated cells. TH1579 treated co-culture showed almost no change in cell proportions day 4 compared with day 0. c For the NRAF set, TH1579 was particularly effective in stopping proliferation of SkMel2, since the proportion of SkMel2 went from 30% day 0 to 11% day 4, as compared with the proportion of control treated co-culture from 30% day 0 to 38% day 4. d FACS analysis shows that BRAF mutant and NRAS mutant CMM cells retain their sensitivity towards TH1579 either when cultured separately or in a co-culture system (error bars represent mean ± SD; n = 3, *p < 0.05, **p < 0.01, ***p < 0.001, ****p < 0.000, Student’s t test). Data shown as ratio of number of Annexin V labeled cells to total number of labeled cells for each cell line (i.e., fraction of survival cells) either co-cultured or as cultured separately, before treatment (day 0), and treatment day 2 and 4. e Representative images of A375 and A375VR4 spheroids treated with DMSO (control) or TH1579 (2 µM) for 72 h (n = 3). f Representative images of spheroid co-culturing of A375 with its vemurafenib resistant subline A375VR4 before and following DMSO (control) or TH1579 (2 µM) for 72 h (n = 3). g Treatment with TH1579 triggers cell death via induction of apoptosis. CMM cells were treated for 48 h with 0.9 µM TH1579 and analyzed by Annexin V + stain and PI + stain (FACS) (error bars represent mean ± SD; n = 3, *p < 0.05, **p < 0.01, ***p < 0.001, ****p < 0.000, Student’s t test). h Histone labeling followed by time-lapse microscopy analysis shows that A375 and A375VR4 CMM cells treated with lower doses of TH1579 (250 nM and 500 nM) display a significantly prolonged mitotic phase (M) followed by mitotic slippage and polynucleation (MS/PN), micronuclei (G1/MN), mitotic slippage (MS) and death in mitosis (DiM). i Representative Images from time-lapse experiment in h. j Quantification of of the time in mitosis in h. (error bars represent mean ± SD; n = 2, *p < 0.05, **p < 0.01, ***p < 0.001, ****p < 0.0001, Student’s t test).

