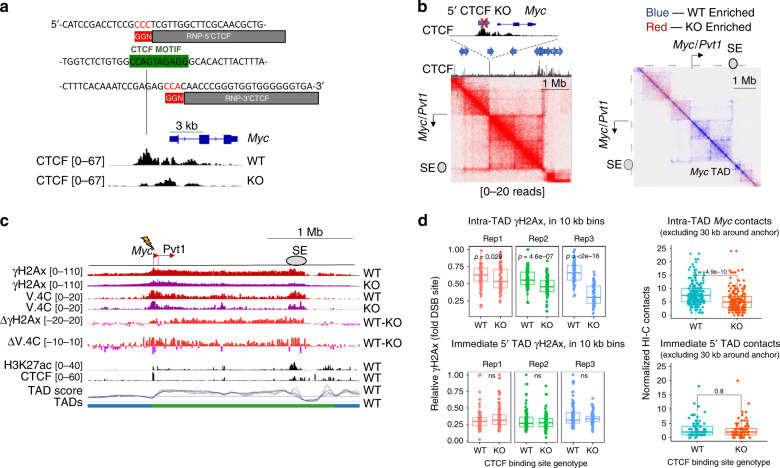
Fig. 4. CTCF is necessary for robust γH2Ax propagation in the Myc-TAD.
a CTCF motif deletion within a TAD border upstream of Myc. Top: Sequence of the upstream Myc-CTCF (green) and RNP target sites (gray and red). RNPs labeled 5′ and 3′ CTCF were used for deletion. Bottom: Myc locus in 5′CTCF WT or KO pre-lymphocyte cells (63–12). Myc exons and UTRs are shown (top). Tracks represent CTCF CR-seq values (black, RPKM, n = 1) and the arrow indicates the CTCF motif. b Interactome of 5′CTCF KO cells. Top left insert shows CTCF ChIP-seq data (0–60 RPKM, n = 1), CTCF motif orientation (blue arrows), TAD border, and deletion site (red X). Bottom: JuiceBox Hi-C plots show the wild-type Myc locus (left) or relative Hi-C interactome changes following CTCF deletion (right) (n = 1, each). Blue points are ≥2 interaction counts higher in WT; red points are ≥2 counts higher in the 5′CTCF KO. The location of the Myc-TAD is indicated on bottom. c UCSC snapshot, as described in Fig. 2, showing the Myc locus in 63–12 cells with and without the 5′ CTCF binding motif (representative of three independent results). For subtraction plots of γH2Ax or V.4C data, red represents WT enrichment, while purple represents KO enrichment. d Myc promoter interactome and γH2Ax derived from 5′CTCF WT or KO cell lines, quantified in 10 kb bins across either the Myc-containing TAD or immediate 5′ TAD. Left: γH2Ax 2 h after 5′CTCF WT or KO cells were nucleofected with RNP Myc-P. Each γH2Ax dataset was first normalized to RPKM values at the DSB-containing bin. Colors represent biologically independent replicates (n = 3). Right: Comparison of Myc promoter interactomes, derived from Hi-C data, across the Myc-containing TAD or immediate 5′ TAD in cells of indicated genotypes, without RNP nucleofection. Relative interactome measurements have been normalized using coverage normalization. For all plots, statistical enrichment (two-sided Paired Student’s t test) is shown above. Non-significant (ns) p values are 0.6, 0.27, and 0.26 for replicates 1, 2, and 3, respectively. Means, quartiles, and outlier limits (1.5 × interquartile range) are indicated by the median line, box and whiskers, respectively.

