
FIGURE 4.
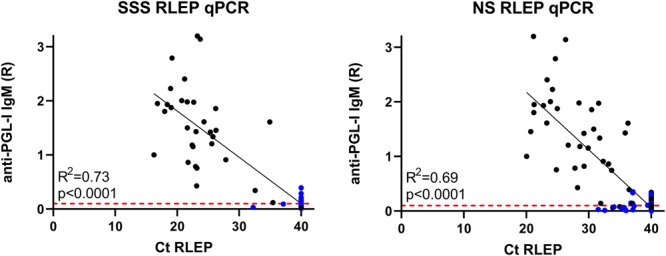
Correlation of IgM antibodies against PGL-I to Ct of RLEP qPCR. Quantified levels of pathogen DNA (qPCR) and host immunity were correlated for samples selected for qPCR analysis based on RLEP positivity in multiple individuals in one household. Each dot represents a sample from one individual; leprosy patients are indicated in black, and healthy household contact in blue. Anti-PGL-I antibody levels were measured by up-converting reporter particles lateral flow assay specific for M. leprae PGL-I IgM antibodies (αPGL-I UCP-LFA) using the Ratio (R) of the Test (T) and flow control (FC) lines as units. Ratios of ≥0.10 were considered positive as indicated by the red dashed line. RLEP cycle threshold (Ct) values are indicated on the x-axis and were measured by qPCR to detect M. leprae DNA in slit skin smears (SSS, left) and nasal swabs (NS, right). Undetermined Cts are depicted as Ct 40.