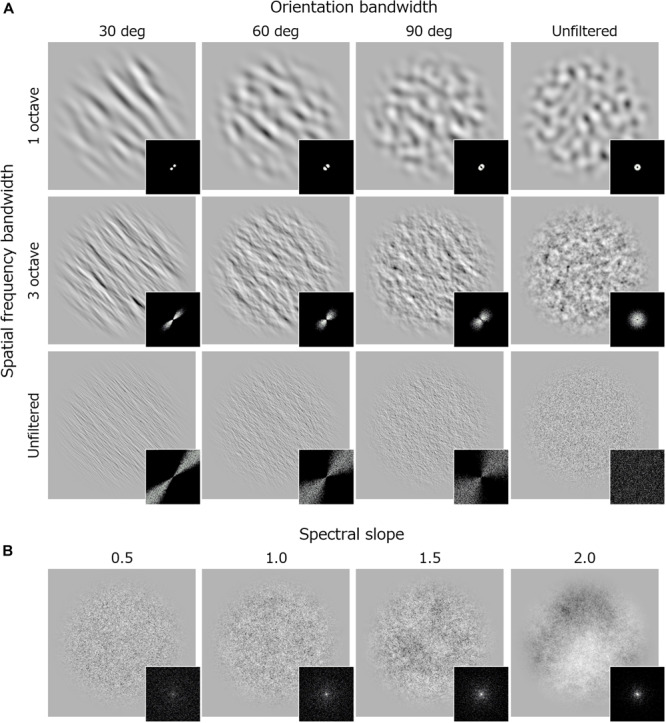
FIGURE 1.

Examples of stimuli and their Fourier spectra used in Experiment 1. (A) Band-pass noise with spatial frequency bandwidth of 1 octave (upper), 3 (middle) octave, and unfiltered noise (lower). Each column shows stimuli with different orientation bandwidth. (B) 1/f noise with various spectral slope.
