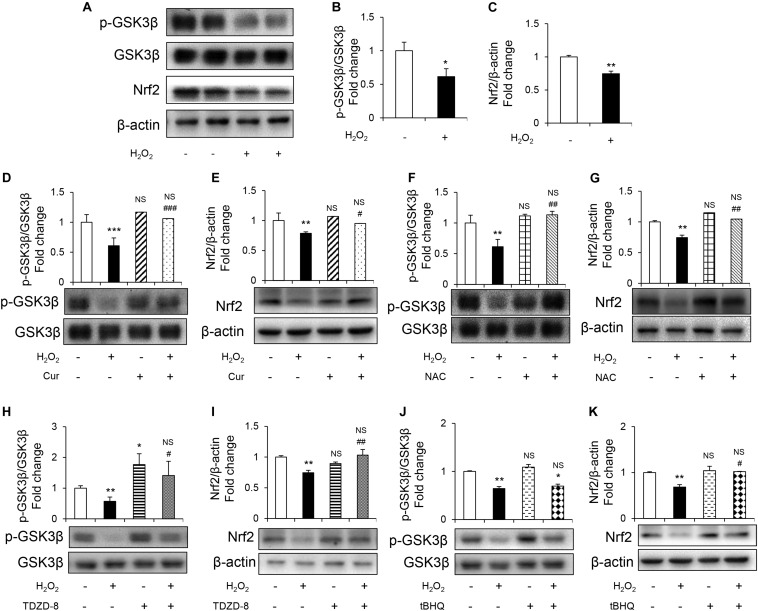
FIGURE 3.
Cur attenuated H2O2-induced osteoblast apoptosis through GSK3β-Nrf2 signaling pathway. MC3T3-E1 cells were treated in the basic medium with or without H2O2 for 6 h. (A) Representative immunoreactive bands for phosphorylated GSK3β, GSK3β, and Nrf2 in MC3T3-E1 cells. (B,C) Quantification of immunoreactive bands for phosphorylated GSK3β relative to GSK3β and Nrf2 relative to β-actin. (D,E) Cur was added 24 h before H2O2. Densitometry of immunoreactive bands for p-GSK3β and GSK3β, Nrf2 and β-actin in MC3T3-E1 cells with (+) or without (–) Cur in the presence of H2O2 (+) or culture medium (–). (F,G) NAC was added 1 h before H2O2. Representative immunoreactive bands and relative levels of p-GSK3β and GSK3β, Nrf2 and β-actin in MC3T3-E1 cells with (+) or without (–) NAC treatment in the presence of H2O2 (+) or culture medium (–). Representative immunoblots are shown at the bottom. (H,I) TDZD-8 was added 1 h before H2O2. Representative immunoreactive bands and relative levels of p-GSK3β and GSK3β, Nrf2, and β-actin in MC3T3-E1 cells with (+) or without (–) TDZD-8 treatment in the presence of H2O2 (+) or culture medium (–). (J,K) tBHQ was added 1 h before H2O2. Representative immunoreactive bands and relative levels of p-GSK3β and GSK3β, Nrf2, and β-actin in MC3T3-E1 cells with (+) or without (–) tBHQ treatment in the presence of H2O2 (+) or culture medium (–). Data are presented as the mean ± SD from at least three independent experiments. *p < 0.05, **p < 0.01, ***p < 0.001, versus C group; NS, non-significantly different from C group. #p < 0.05, ##p < 0.01, ###p < 0.001, versus the H2O2 group; ns, non-significantly different from H2O2 group.

