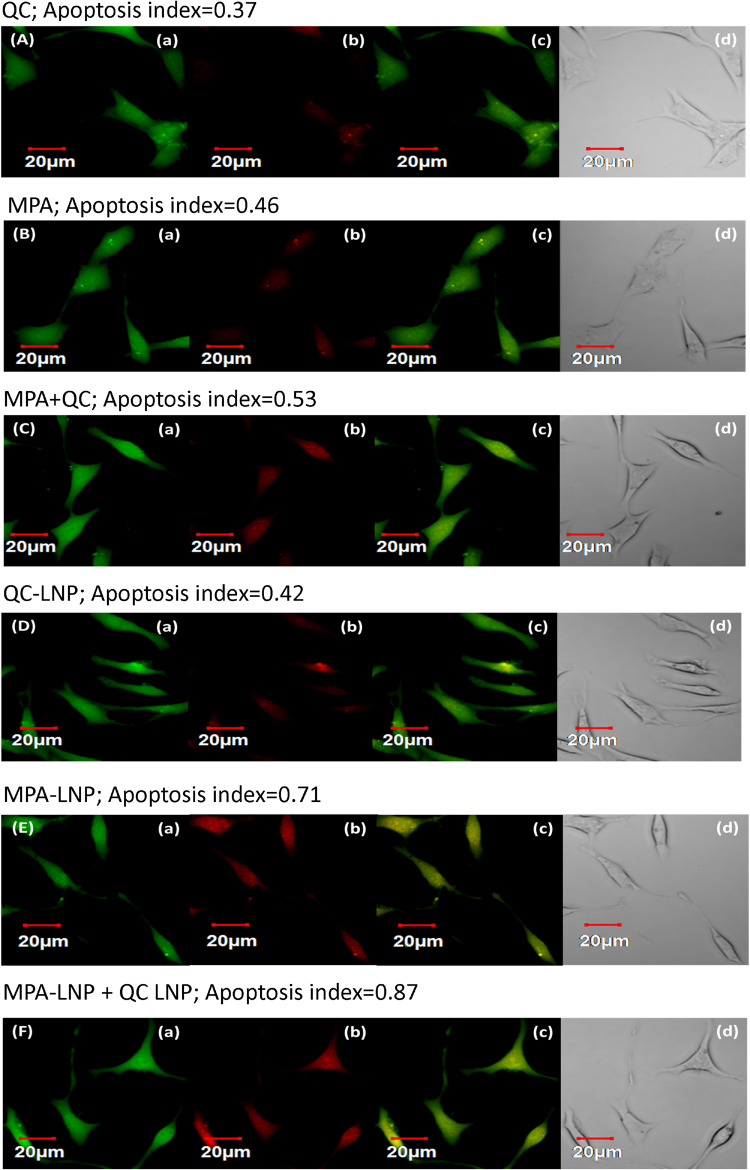
FIGURE 5.
Apoptosis assay of QC (A), MPA (B), combination of MPA + QC (C), QC-LNP (D), MPA-LNP (E) and combination of MPA-LNP + QC-LNP (F) against MCF-7 cell line. (a) shows the green fluorescence from carboxy fluorescein (cell viability marker dye); (b) illustrates red fluorescence from annexinCy3.18 conjugate (cell apoptosis marker dye) (c) denotes the overlay image of green and red fluorescence and (d) depicts the differential contrast image of representative cells.

