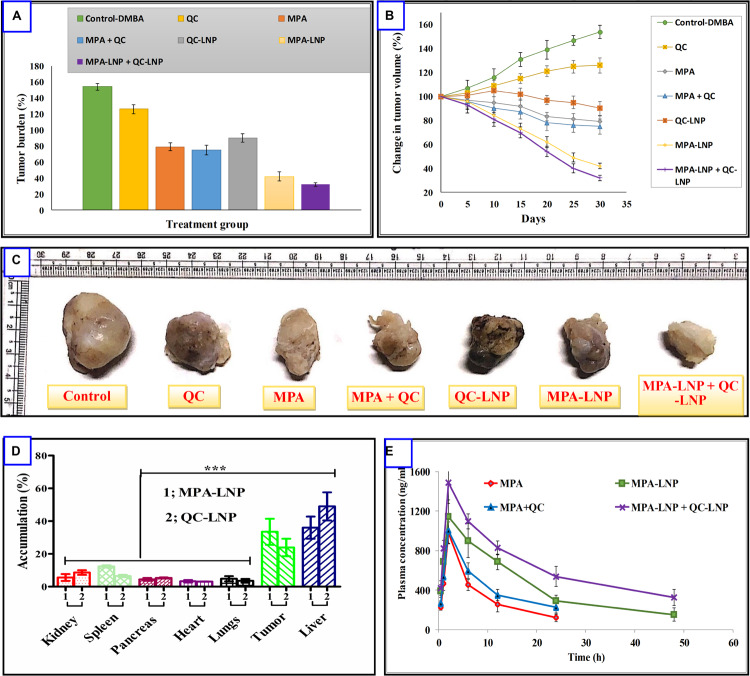
FIGURE 6.
(A) Comparison of % change in tumor volume treated with different formulation and their combination (B) % tumor burden in animals treated with different formulations (C) representative photographs of excised tumors from different treatment groups. (D) Drug distribution profile of MPA and QC in the various organ of SD rat. (E) Plasma concentration-time profiles of MPA, MPA–LNP, MPA + QC, and MPA-LNP + QC-LNP following the i.p. administration in rats. Asterisks represents, ***P < 0.001.

