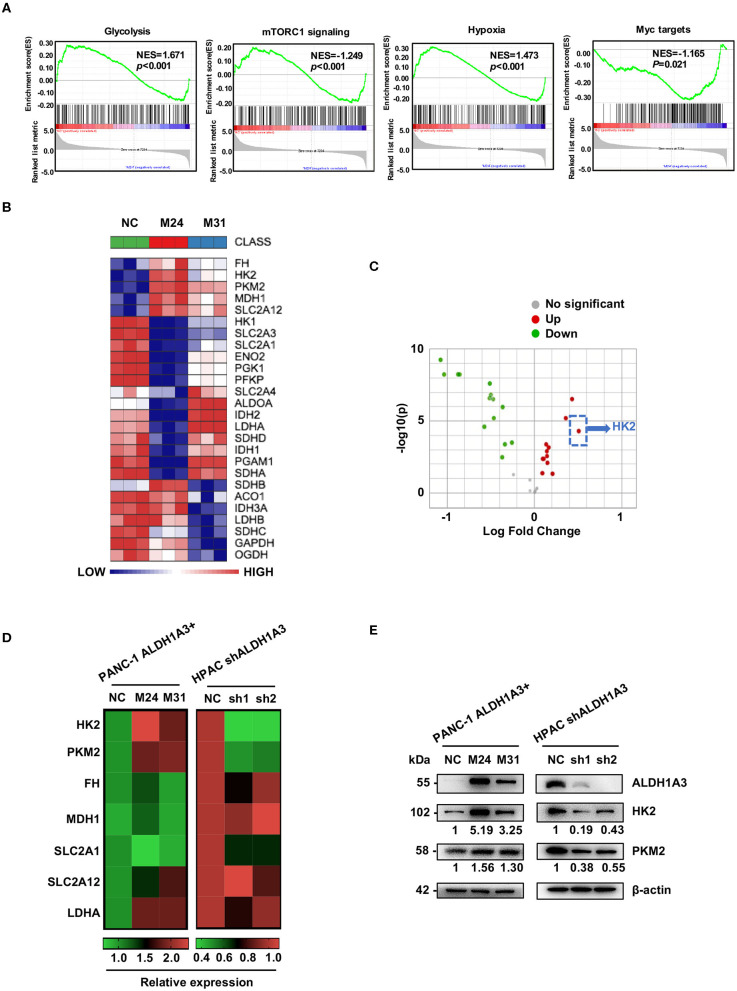
Figure 3.
ALDH1A3 promotes the expression of key enzymes of glycolysis. (A) GSEA using hallmark gene sets was performed to compare the ALDH1A3 overexpression group and negative control group. NES, normalized enrichment score. (B) A heat map showing the expression of glycolysis-related genes across ALDH1A3 overexpression samples and negative control samples. (C) A volcano plot showed the fold change of glycolysis-related genes after the overexpression of ALDH1A3 in PANC-1 cells. (D) QRT-PCR results showed the relative mRNA levels of glycolysis-related genes in PANC-1 cells conducted by ALDH1A3 overexpression or in HPAC cells conducted by ALDH1A3 knock-down. (E) Western-blotting results showed the protein level of HK2 and PKM2 expression in PANC-1 cells conducted by ALDH1A3 overexpression or in HPAC cells conducted by ALDH1A3 knock-down.

