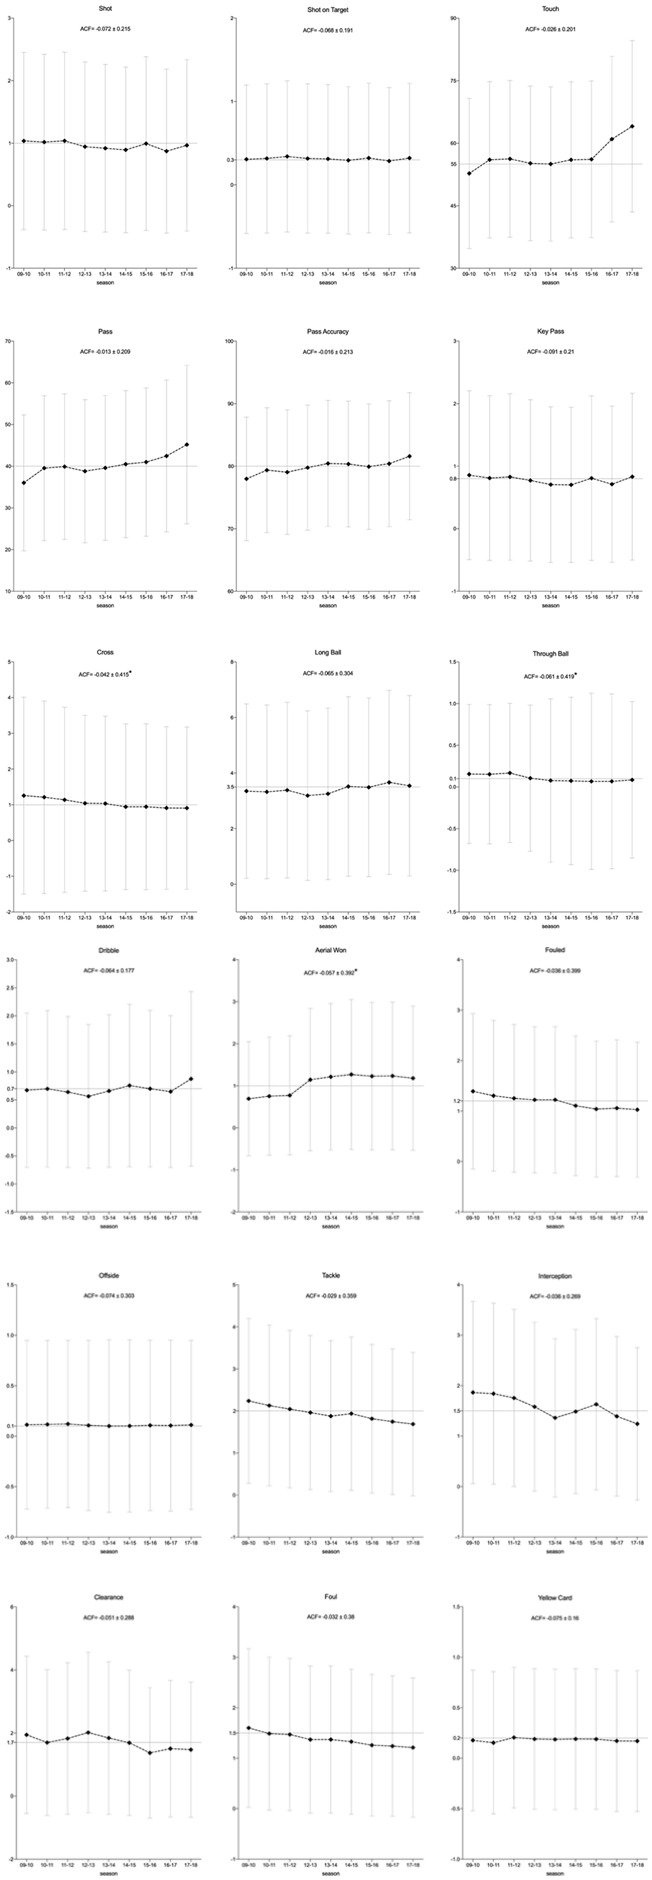
FIGURE 1.

Temporal changes of each technical performance indicators from season 2009/2010 to 2017/2018. Black dot and error bar indicate the mean value and standard deviation, respectively. Value of ACF is presented as mean value of 7 lags with the form of mean ± standard deviation. Asterisk indicate the statistical significance.
