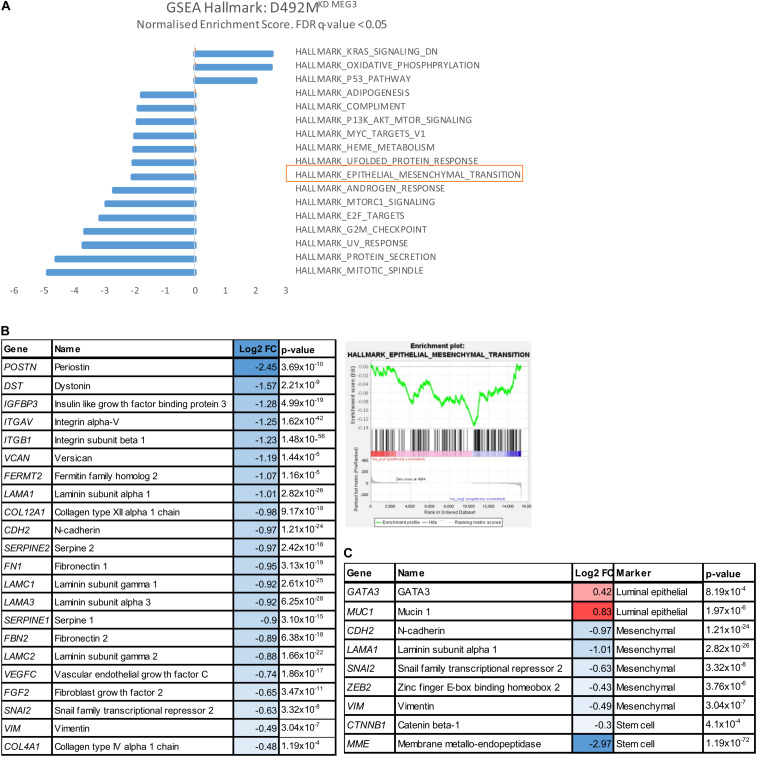
FIGURE 6.
Knock down of MEG3 in D492M decrease mesenchymal markers. (A) Epithelial-mesenchymal transition gene set is enriched pathway in D492MKD–MEG3 (highlighted in orange). Bar plot of Gene Set Enrichment Analysis (GSEA) with Hallmark dataset showing all significantly (False discovery rate-FDR q ≤ 0.05) enriched pathways in D492MKD–MEG3. Gene set Epithelial-mesenchymal transition has normalized enrichment score (NES) of –2.06 and FDR q = 0.014. (B) Knock-down of MEG3 correlates with downregulation of mesenchymal genes relevant for breast cells. Enrichment plot showing the Enrichment Score (ES) of the genes in the Hallmark gene set Epithelial-mesenchymal transition in D492MKD–MEG3. The genes are overrepresented toward the top the ranked list of D492MKD–MEG3 (right). Table with relevant genes for breast cells, significantly (p ≤ 0.05) deregulated, from the Hallmark gene list epithelial-mesenchymal transition showing Log2 fold change (FC; left). (C) Luminal epithelial markers (GATA3 and MUC1) are upregulated, while myoepithelial (KRT14), mesenchymal (CDH2, LAMA1, SNAI2, VIM, and ZEB2) and stem cell (CTNNB1 and MME) are downregulated with knock down of MEG3. Genes from literature-based list of markers significantly (p ≤ 0.05) differentially expressed in D492MKD–MEG3 vs D492MKD–CTRL.

