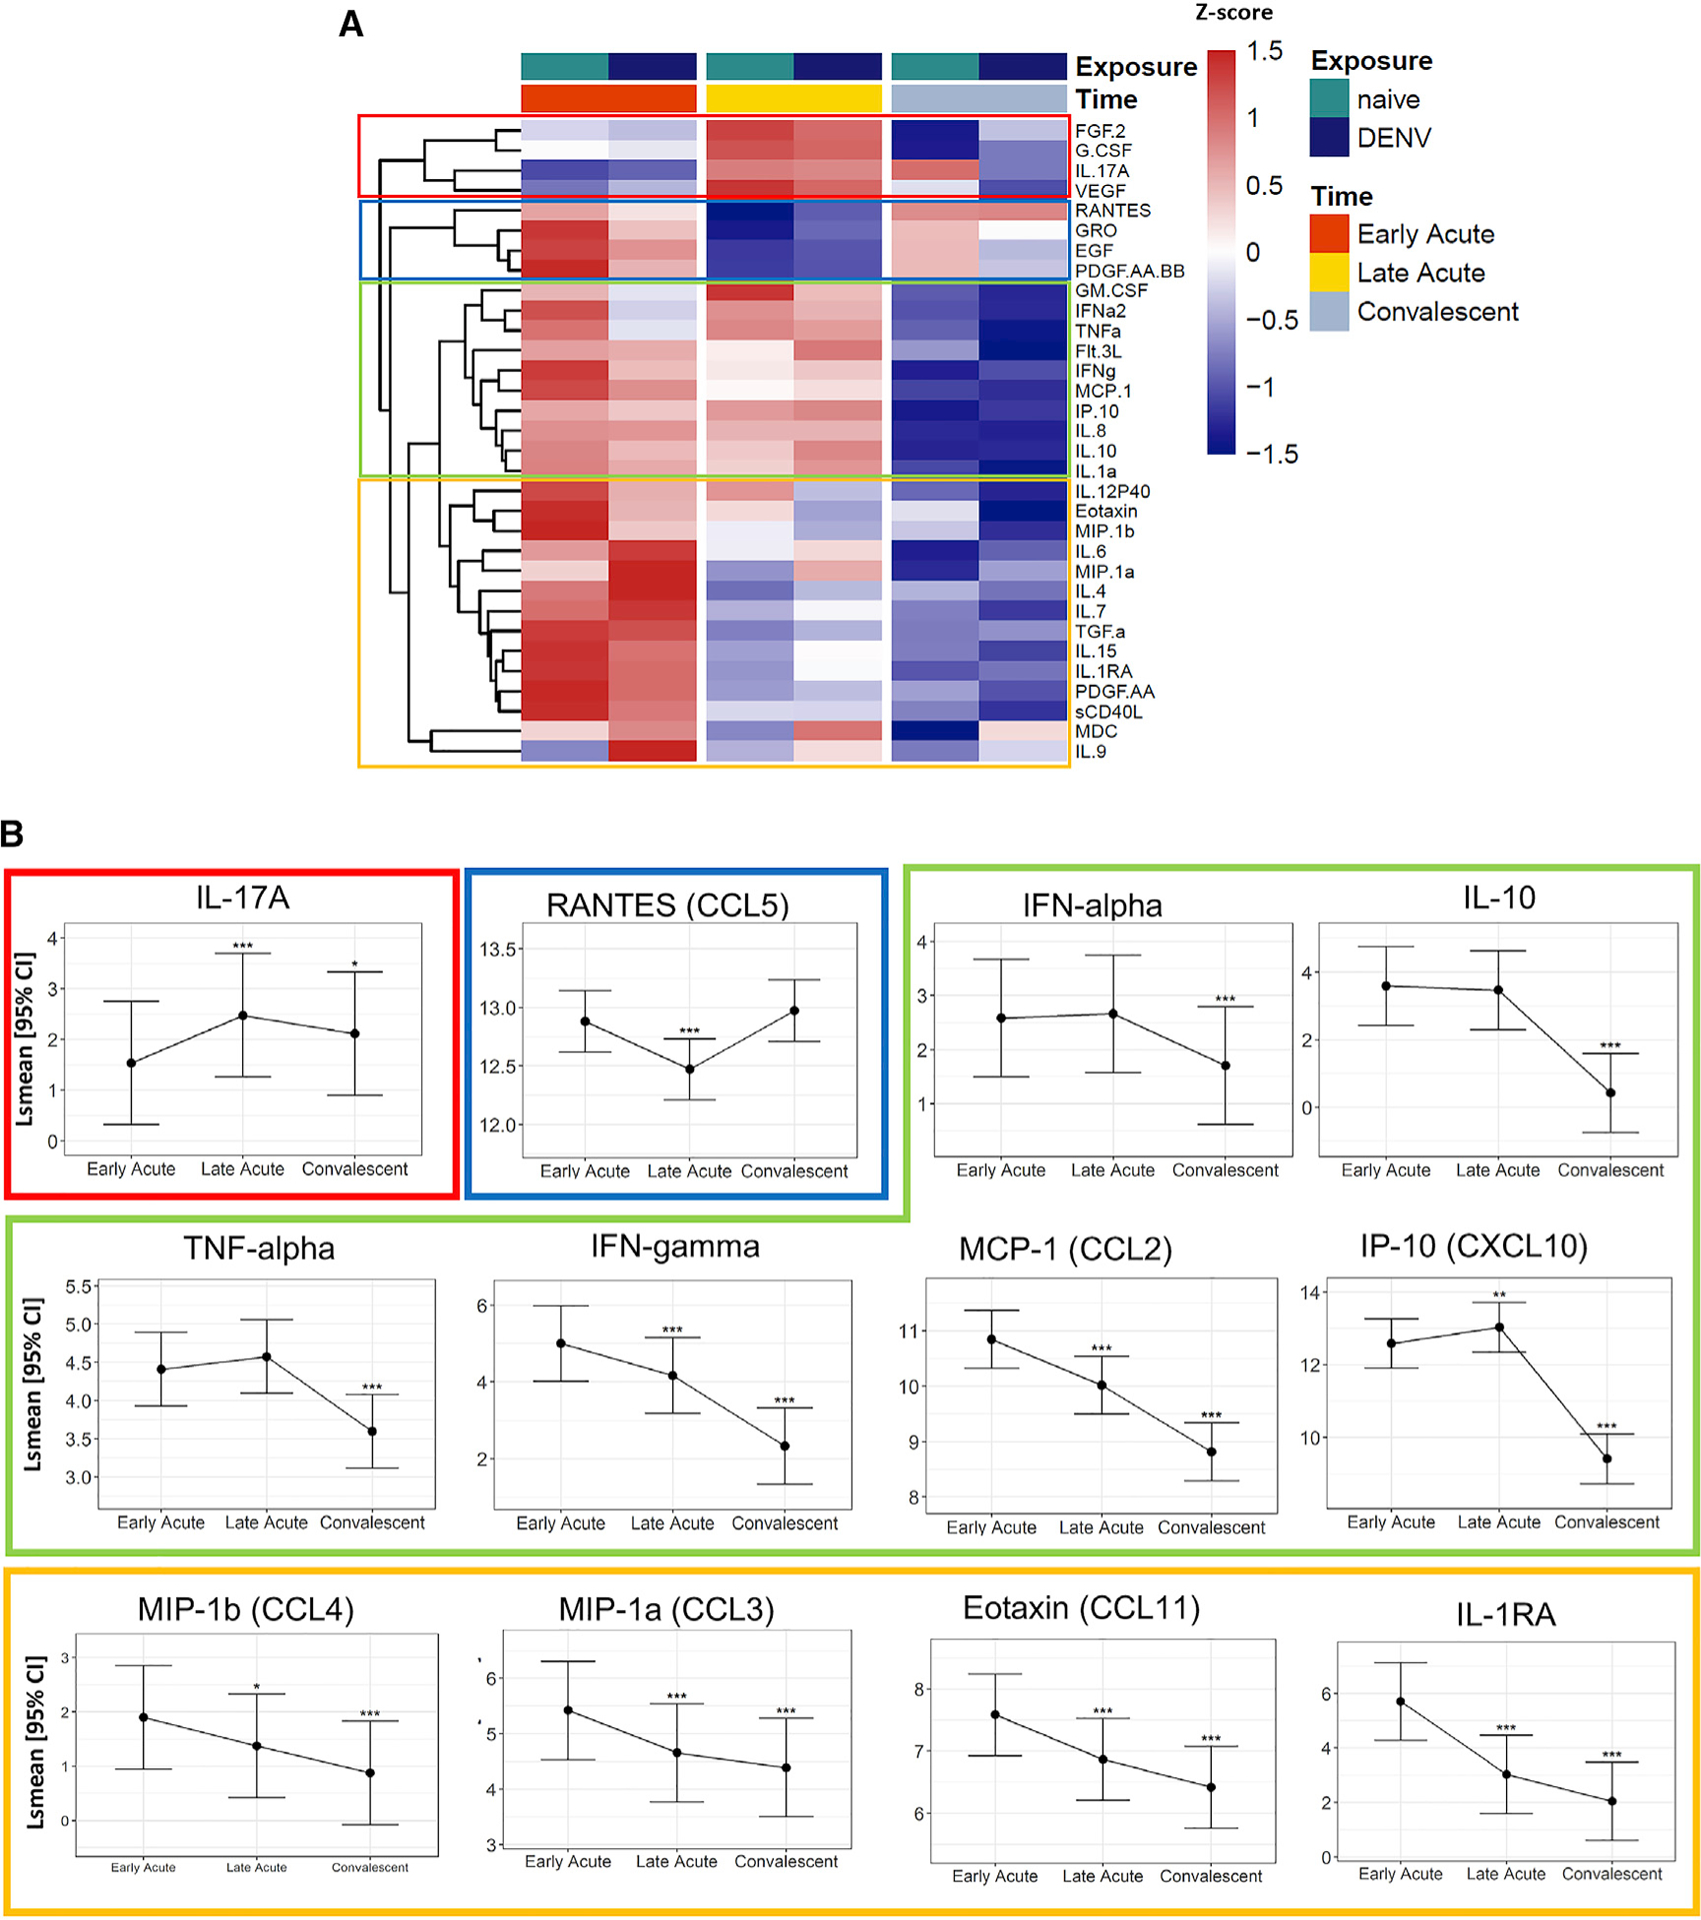
Figure 3. Plasma Cytokine and Chemokine Levels during Early Acute, Late Acute, and Convalescent ZIKV Infections Are Differentially Expressed and Reveal a Central Role for Monocytes.

(A) Heatmap representation of the average protein expression of significant changes (FDR < 0.05) of cytokine levels (pg/mL) over time. The color of the heatmap in each row is based on Z score values calculated by centering and scaling the data by standard deviation using the formula (X m)/SD), where X is individual values, and m is the mean of the row.
(B) Estimated lsmean and 95% CI are shown for selected cytokines. Asterisks above the CI bars represent significance of the changes from late-acute or convalescent to early-acute phase (n = 89). The adjusted p value is shown as *FDR < 0.05, **FDR < 0.01, ***FDR < 0.001.
See also Figures S4 and S5 and Table S1.
