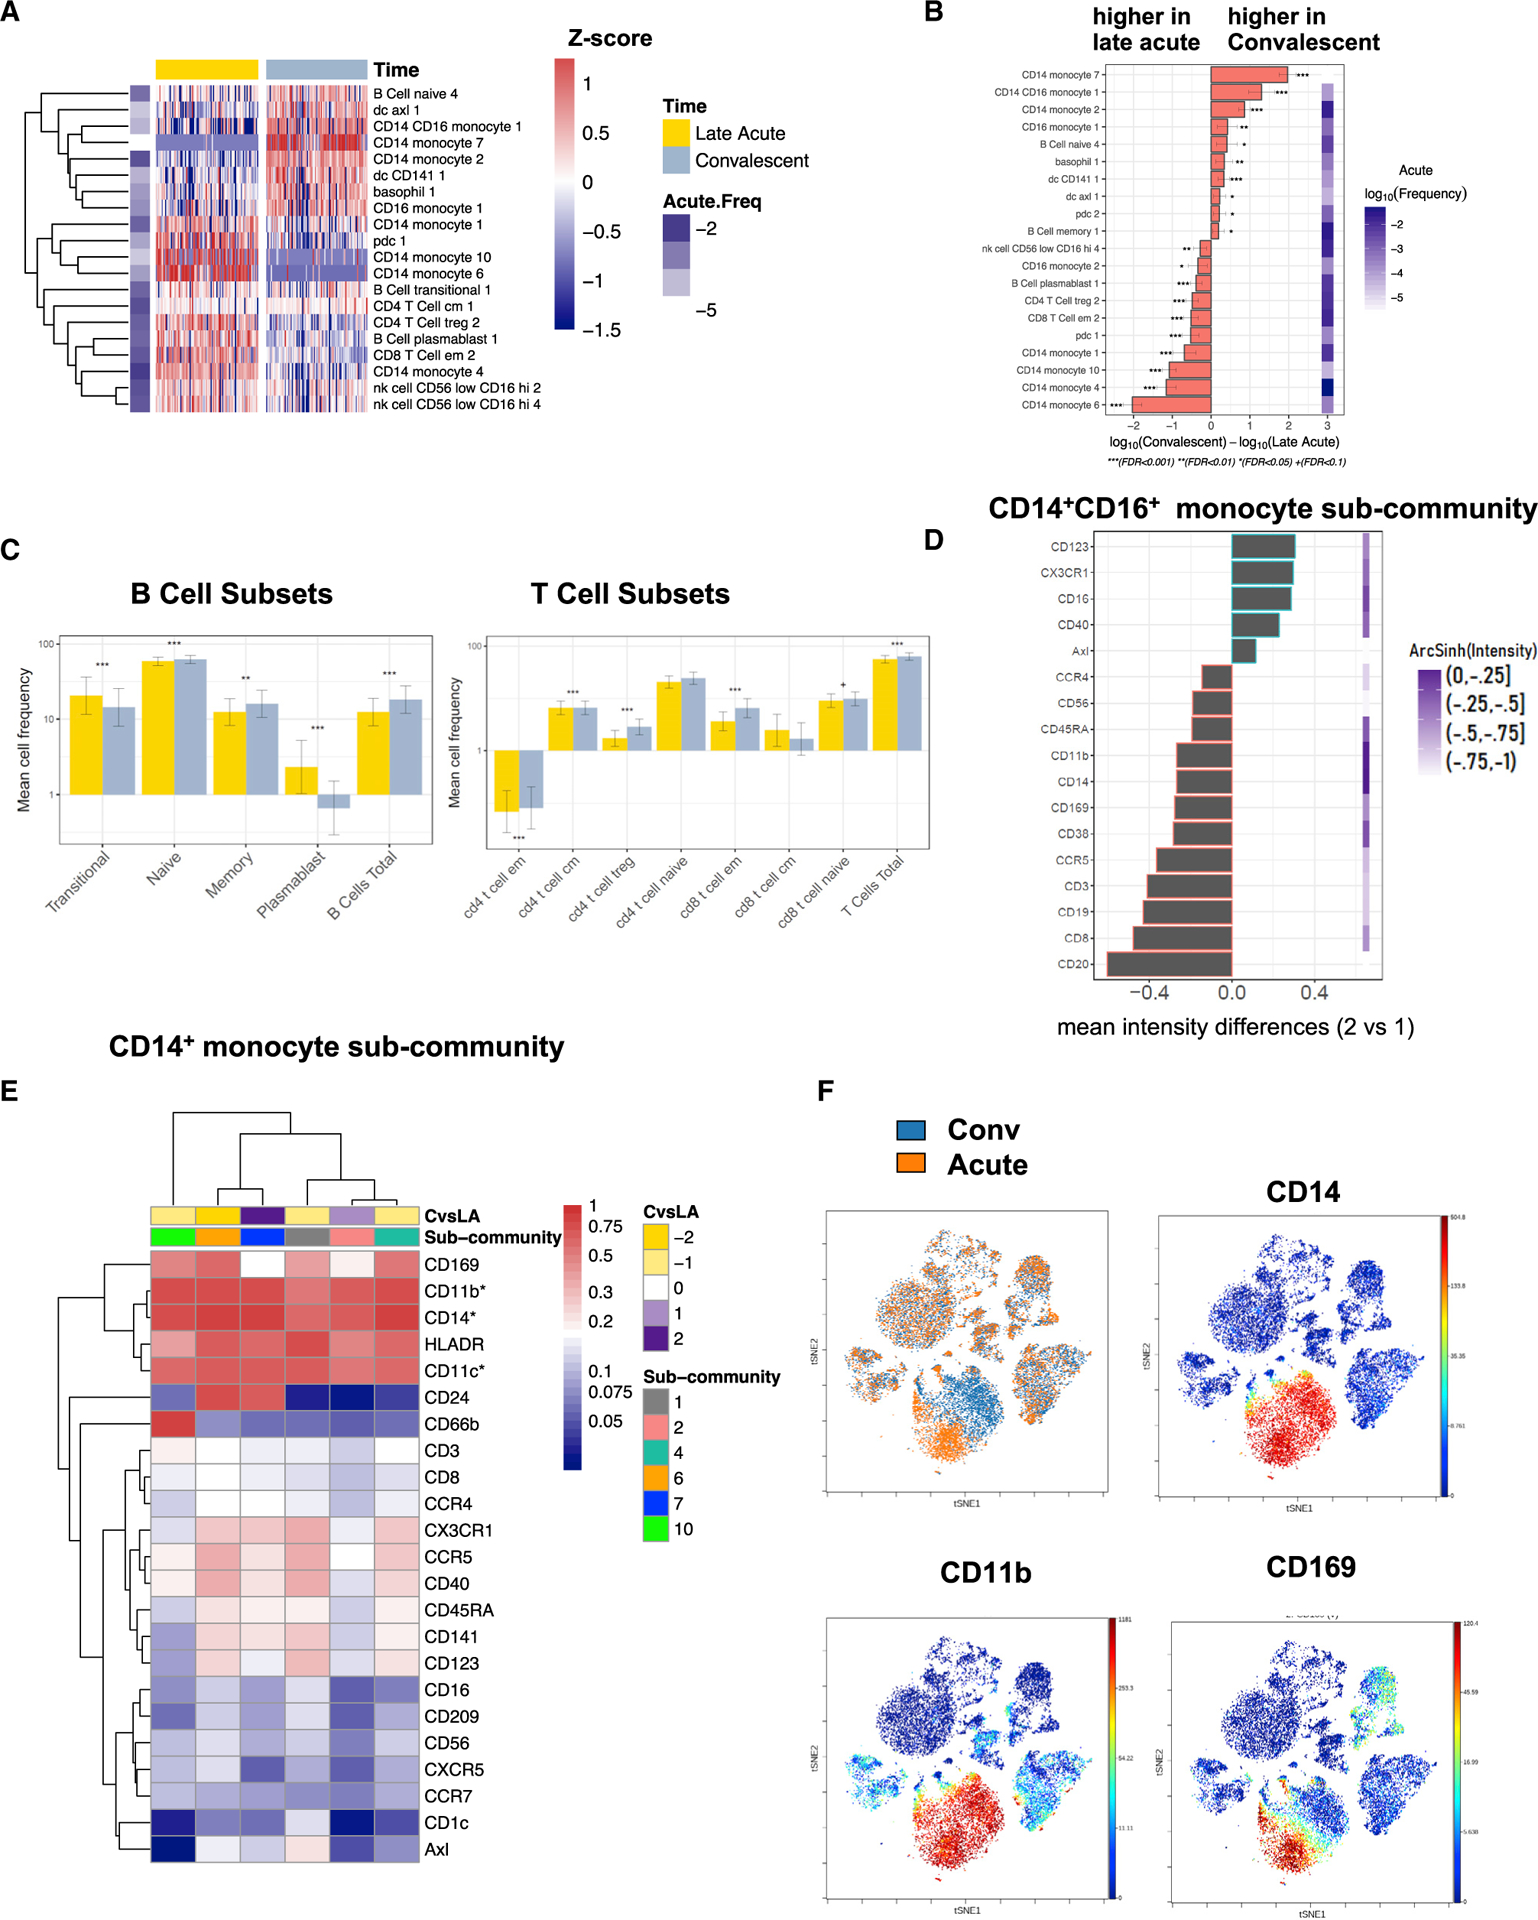
Figure 4. Acute Symptomatic ZIKV Infection Results in Changes in Immunophenotypic Signatures.

(A) Heatmap representation of the average log10-scaled cell frequency profiles in ZIKV-infected patients for cell subcommunities (FDR < 0.05, FCH > 1.5). Values were standardized for each cell population. The color key to the left of the heatmap indicates the average abundance of that subcommunity at the late-acute phase.
(B) Changes in cell subcommunities from acute to convalescent time points (FDR < 0.05, FCH > 1.5).
(C) Mean cell frequency for B and T cell subsets at the late-acute (yellow) and convalescent (gray) phase, with asterisks representing significance among time points. Error bars are 95% CI; *FDR < 0.05, **FDR < 0.01, ***FDR < 0.001.
(D) Differences in marker expression estimated as the median intensity across CD14+CD16+ populations (subcommunity 2 vs subcommunity 1) with a mean arcsinh (intensity) greater than −1.
(E) Mean marker expression for subcommunities of CD14+ monocytes that are significantly changed during ZIKV infection (FDR < 0.05, FCH > 1.3).
(F) Representative viSNE plots of a DENV-naive patient (patient ID 4515). The top-left panel depicts acute (orange) and convalescent (blue) PBMCs. The top-right, bottom-right, and left panels depict intensity of expression of CD14, CD11b, and CD169, respectively, in the same patient. Intensity of expression is expressed as color ranging from red (high expression) to blue (no expression).
