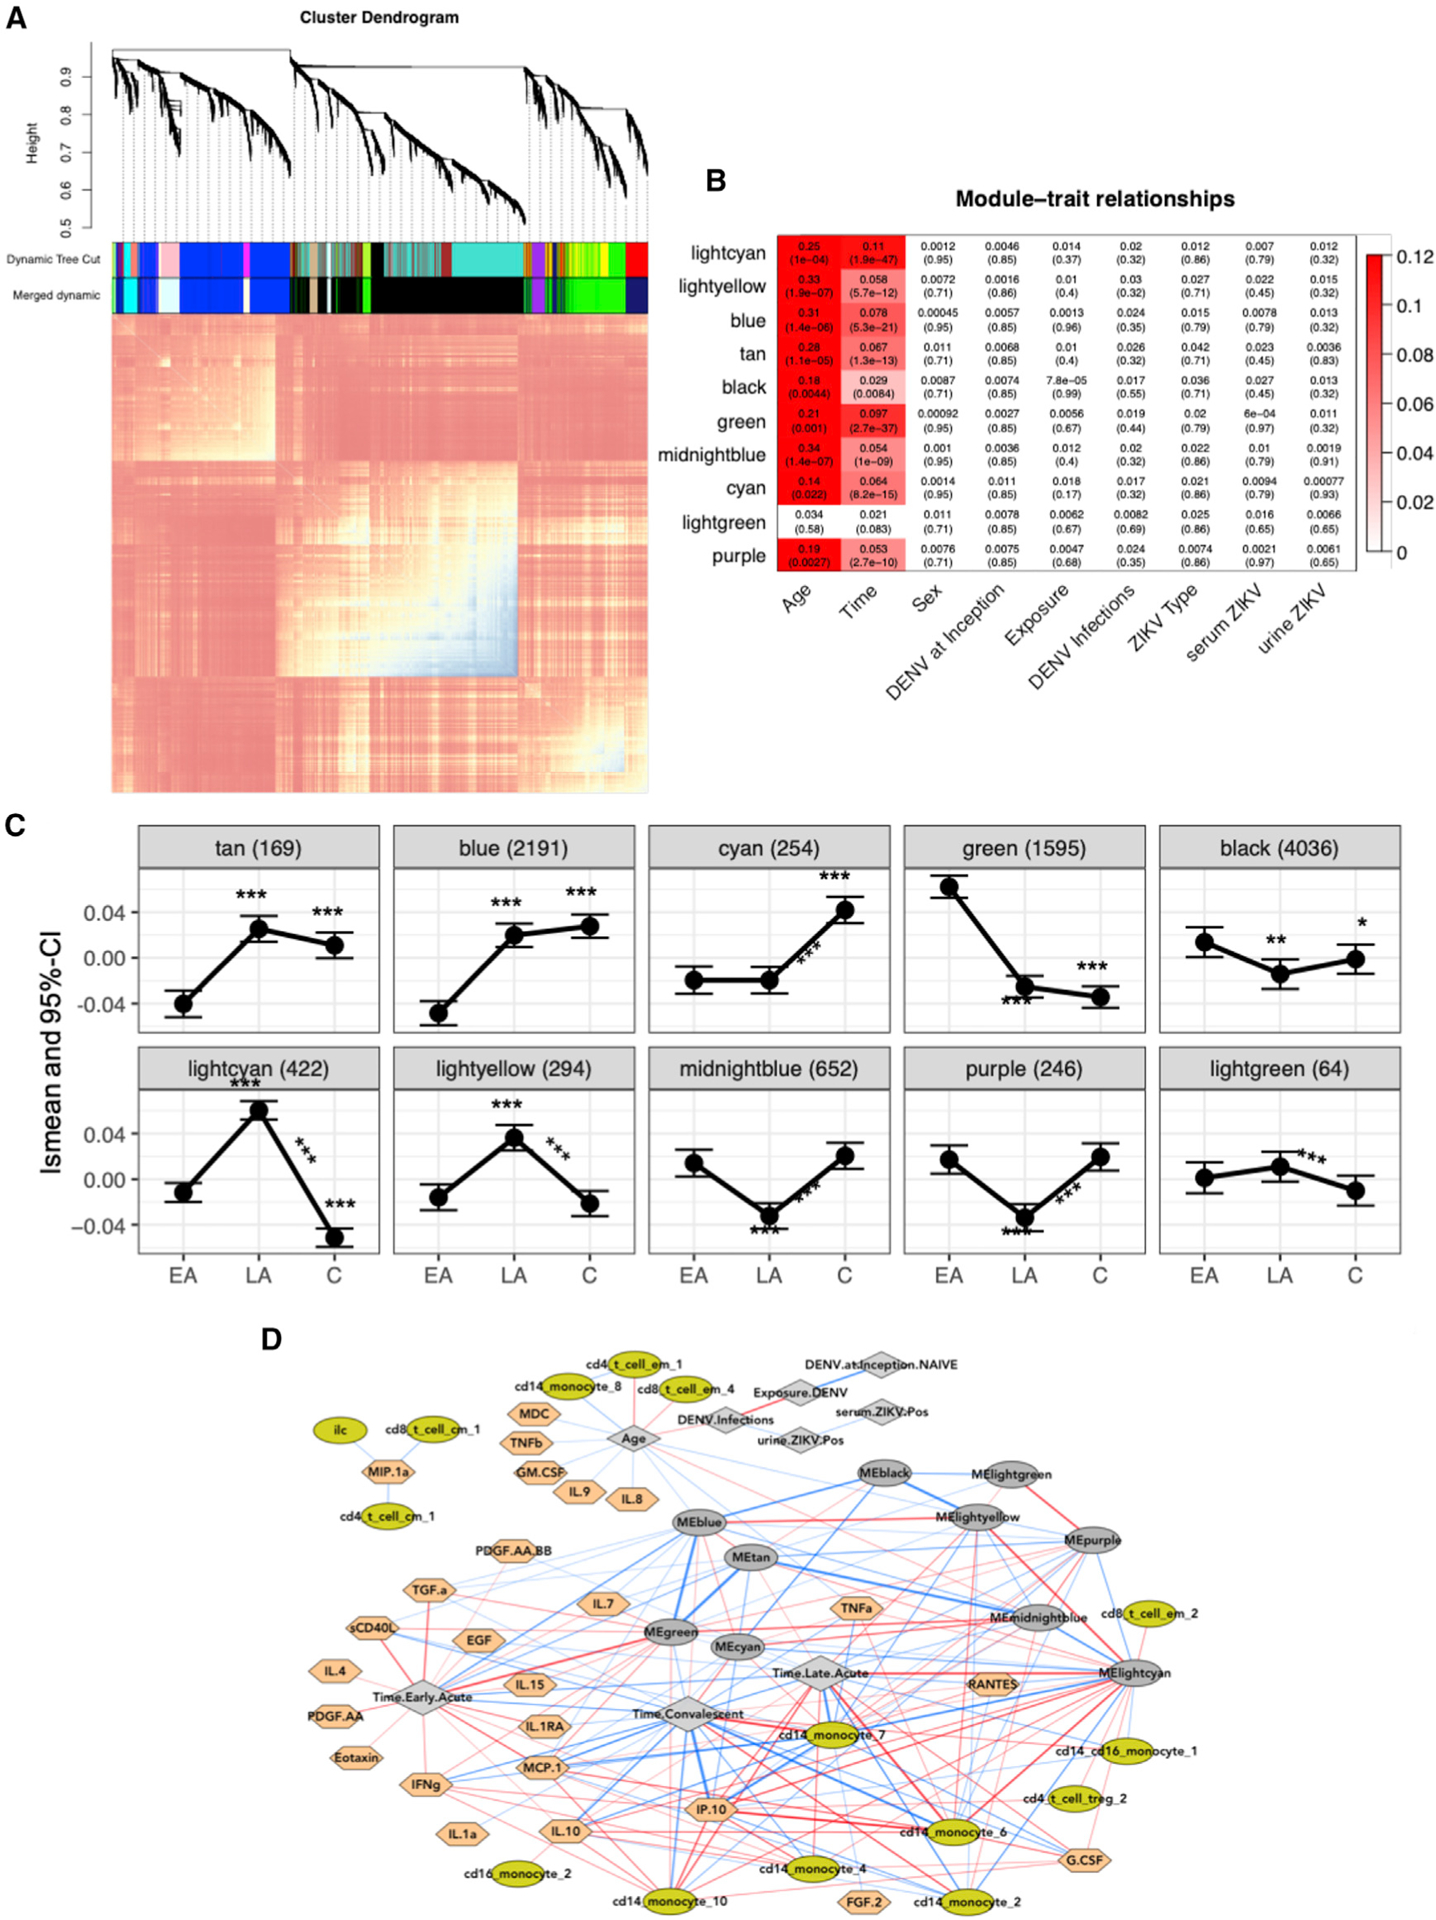
Figure 6. Multiscale Network Analysis Highlights the Temporal Dynamics during the Innate Immune Response to ZIKV Infection and Identifies Key Markers at the Protein and RNA Level.

(A) Topological overlap matrix (TOM) plot of coexpression networks created from gene expression profiling of all samples across all time points. At the top, a dendrogram of the hierarchical clustering of the matrix that undergoes a dynamic tree-cut operation to form gene co-expression network modules (coEMs) is shown by the colored bars on the edges of the TOM plot (color assignment is arbitrary).
(B) Association between modules and important covariates by module. FDR-adjusted p values are displayed in parentheses. Colors represent the effect size of significant associations and are shown in the legend on the right (FDR < 0.05).
(C) Estimated lsmean and 95% CI are shown at each time point for each selected gene module. Asterisks above and below the CI bars represent significant changes from late-acute or convalescent to early-acute time points. Asterisks above the lines connecting the time points represent significant changes between the late-acute and convalescent time points. *FDR < 0.05, **FDR < 0.01, ***FDR < 0.001.
(D) Multiscale network of all cell subcommunities, cytokines, and coEM eigengenes are depicted with a force-directed layout. Light green, cell subcommunities; dark gray oval, coEM eigengenes; gray diamond, clinical variables; peach, cytokines; red and blue lines (edges) are positive or negative correlations, respectively. Lines are filtered to FDR < 0.01, and the thickness of the line corresponds to the square of the correlations.
See also Table S7.
