
Figure 1.
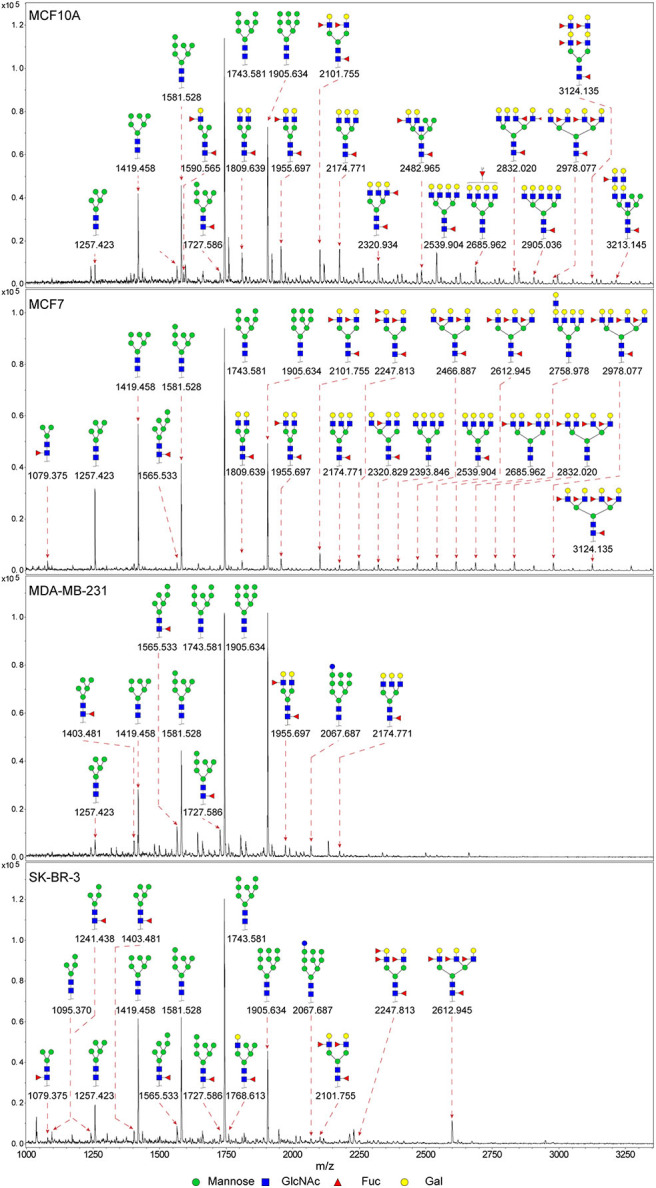
MALDI-TOF-MS spectra of N-glycans. MCF10A, MCF7, MDA-MB-231, and SK-BR-3 cells were cultured in 10 cm dishes, and N-glycans from these cells were isolated as described as M&M. The lyophilized N-glycans were dissolved in methanol/water (1:1, v/v) solution, and an aliquot of the mixture with DHB solution was spotted on an MTP AnchorChip sample target and air-dried. MALDI-TOF-MS was performed in positive-ion mode. Experiments were performed in biological triplicate, and representative N-glycan spectra were shown. Peaks (signal-to-noise ratio >6) were selected for relative proportion analysis. Detailed structures were analyzed using GlycoWorkbench software. Proposed structures were indicated by m/z value.