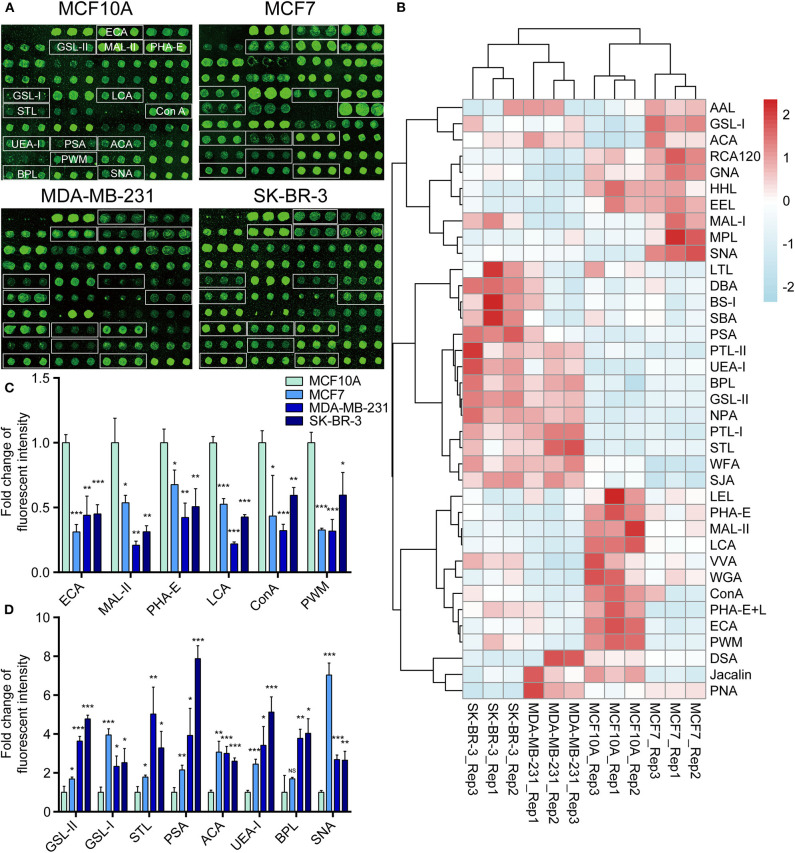
Figure 2.
Variation of glycan pattern recognized by lectin microarrays. (A) Fluorescence intensities of 37 lectins from the MCF10A, MCF7, MDA-MB-231, and SK-BR-3 cells were scanned. (B) Variation of expression of glycans recognized by 37 lectins as a heatmap. Red: fluorescence signal activation. Blue: signal inhibition. (C) Relative fluorescence intensities of downregulated glycopatterns recognized by 6 lectins (using cut-offs of p < 0.05, fold change p < 0.67) in BCa cells comparing to normal breast cells. (D) Relative fluorescence intensities of up-regulated glycopatterns recognized by 7 lectins (using cut-offs of p < 0.05, fold change p >1.5). *p < 0.05; **p < 0.01; ***p < 0.001; NS, p > 0.05.

