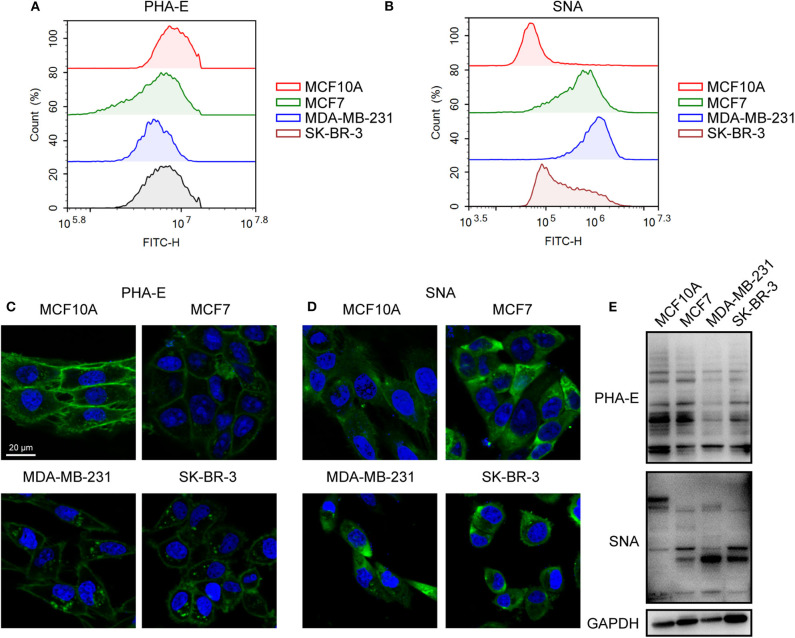
Figure 3.
Altered levels of glycan pattern in BC cells. Levels of bisecting GlcNAc (A) and α2-6 linked sialic acids (B) in normal and BC cells by flow cytometry. Levels of bisecting GlcNAc (C) and α2-6 linked sialic acids (D) by lectin staining. (E) Levels of bisecting GlcNAc and α2-6 linked sialic acids by lectin blot.

