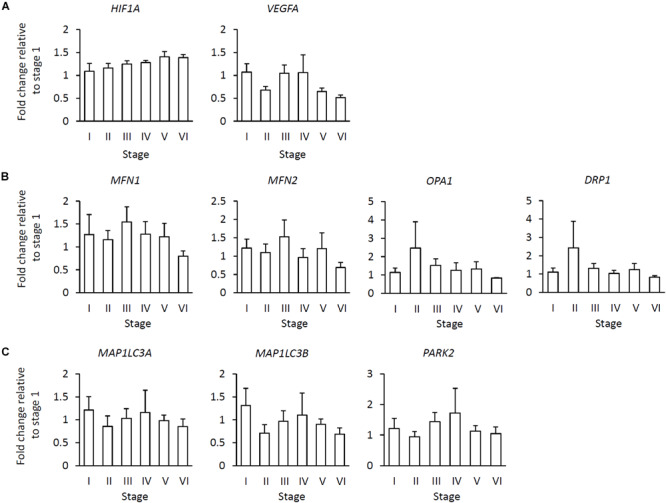
FIGURE 3.

Relationship of gene expression levels in the various stages to fibrotic area in the muscle. (A) Hypoxia-adaptive gene expression including hypoxia inducible factor 1 subunit alpha (HIF1A) and vascular endothelial growth factor A (VEGFA). (B) Mitochondrial dynamics-related gene expression including mitofusion 1, 2 (MFN1, 2), OPA1, mitochondrial dynamin-like GTPase (OPA1), and dynamin-related protein 1 (DRP1). (C) Autophagy-/mitophagy-related gene expression including microtubule-associated protein 1 light chain 3 alpha, beta (MAP1LC3A, B) and parkin RBR E3 ubiquitin protein ligase (PARK2). Data represent the means ± SE [stage I (n = 6), stage II (n = 5), stage III (n = 6), stage IV (n = 5), stage V (n = 9), and stage VI (n = 4), Tukey test (P < 0.05)].
