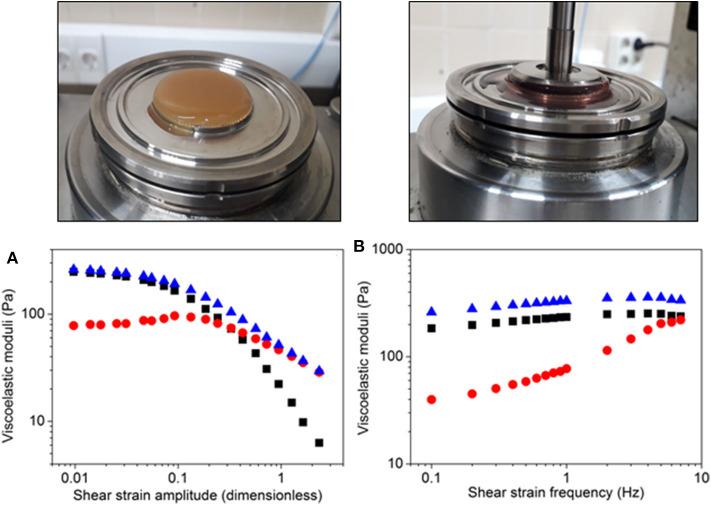
Figure 2.
Rheological characterization of FATLH. Representative FATLH images are shown above, before and during the rheological analysis. (A) Viscoelastic moduli as a function of shear strain amplitude for imposed oscillatory shear strain of fixed frequency (1 Hz). (B) Viscoelastic moduli as a function of shear strain frequency for imposed oscillatory shear strain of fixed amplitude (0.02). Squares (▪) represent the storage modulus, circles ( ) the loss modulus, and triangles (
 ), the complex modulus.

