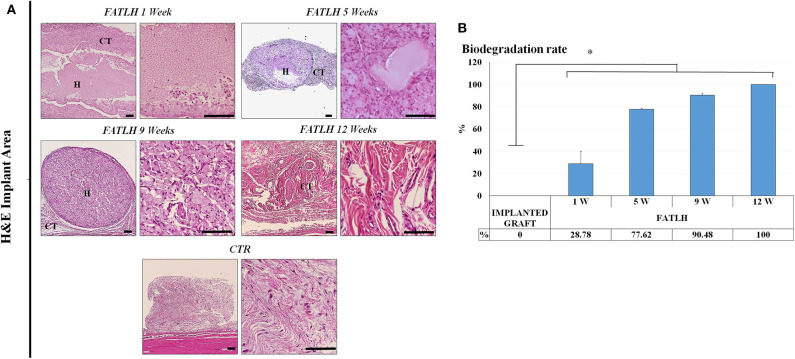
Figure 3.
Histological analysis of FATLH grafted in vivo using hematoxylin-eosin (H&E). (A) Representative images of control samples (CTR) and the implanting site of the experimental groups (FATLH) at different follow-up times. H = grafted FATLH biomaterials; CT = connective tissue. Scale bar = 100 μm. (B) Quantification of the percentage of FATLH biodegraded at each study time (1, 5, 9, and 12 weeks). Results are shown as percentage of the implant that were biodegraded regarding the size od the original implanted graft. *Differences between each study time and the original size of the implanted graft were statistically significant.

