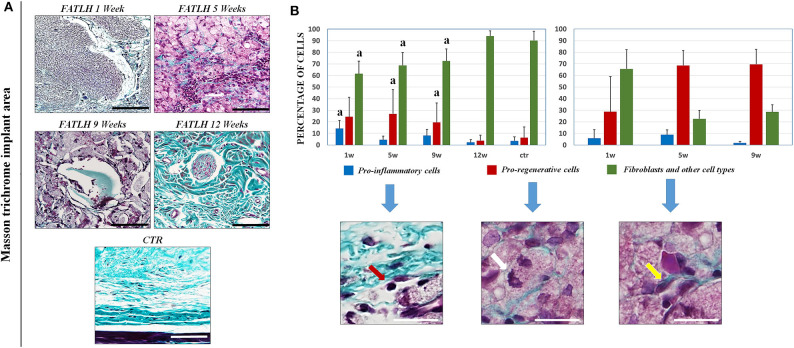
Figure 4.
Histochemical analysis of FATLH grafted in vivo using the masson trichrome staining. (A) Representative images of controls and implanted FATLH at different periods of time. Scale bar = 100 μm. (B) Analysis of the types of cells found at the implant site (left panel) and inside the biomaterial (right panel). For the implant site, results are shown at 1, 5, 9, and 12 weeks of follow-up, whereas 1, 5, and 9 weeks samples are shown for cells colonizing the biomaterial, since controls and 12-weeks samples did not contain any grafted material. Results are shown as percentage of each cell type in each histological sample. “a” = significant differences vs. controls. Illustrative examples of each type of cells are shown and labeled with red arrows (pro-inflamatory cells), white arrows (pro-regenerative cells), and fibroblast and other type of cells (yellow arrows). Scale bar = 30 μm.

