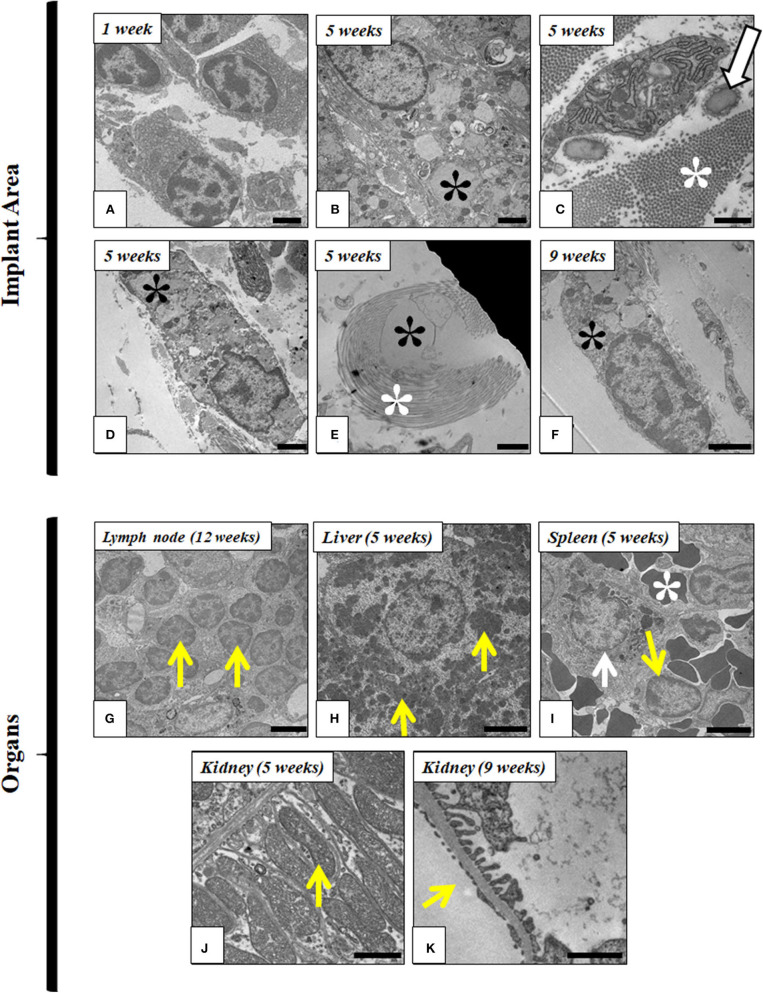
Figure 8.
Ultrastructural analysis of FATLH implanted in laboratory animals. Representative images of the local implant site are shown in (A–F), while distal organs are shown in (G–K). (A) Plasmocyte cells at the implant site (1 week); Scale bar = 2 μm. (B) Macrophage phagocytizing fibrin-agarose (black asterisk*) (5 weeks); Scale bar = 2 μm; (C) Fibroblast cell immersed in a rich extracellular matrix containing collagen (white asterisk*) and elastic fibers (arrow) (5 weeks); Scale bar = 1 μm. (D) Macrophage phagocytizing fibrin-agarose (black asterisk*) (5 weeks); Scale bar = 1 μm. (E) Fibrin-agarose (black asterisk*) surrounded by collagen fibers (white asterisk*) (5 weeks); Scale bar = 1 μm. (F) Fibroblast phagocytizing fibrin-agarose (black asterisk*) (9 weeks); Scale bar = 2 μm. (G) Lymphocyte in satellite lymph node (yellow arrows) (12 weeks); Scale bar = 2 μm. (H) Hepatocytes containing glycogen (yellow arrows) (5 weeks); Scale bar = 5 μm. (I) Spleen macrophage phagocytizing iron (white arrow), lymphocyte (yellow arrow), and erythrocytes (white asterisk*) (5 weeks); Scale bar = 5 μm. (J) Basal region of proximal convoluted tubules of the kidney showing abundant mitochondria (yellow arrow) (5 weeks); Scale bar = 1 μm. (K) Glomerular filtration barrier in kidney (yellow arrow) (9 weeks); Scale bar = 1 μm.

