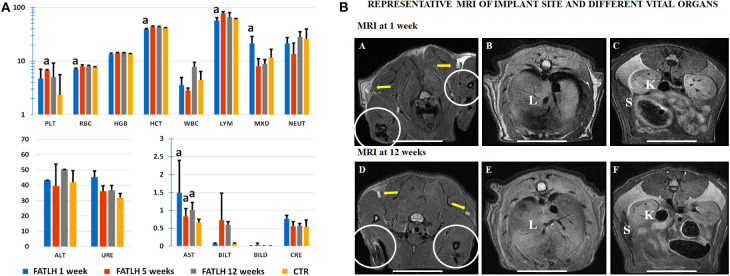
Figure 9.
Laboratory testing and magnetic resonance images (MRI) analysis of controls (CTR) and animals grafted with FATLH. (A) Hemogram and biochemistry analysis in blood of control and study animals at different times (1, 5, and 12 weeks). PLT: Platelets (105/μL−1), RBC: Erythrocytes count (106/μL−1), HGB: concentration of hemoglobin (g/dL), HCT: hematocrit count (%), WBC: white blood cells (103/μL−1), LYM: lymphocytes (%), MXD: monocytes-basophils-eosinophils (%), NEUT: neutrophils (%), ALT: Alanine aminotransferase (U/L), URE: urea (mg/dL), AST: aspartate aminotransferase (102/U/L), BILT: total bilirubin (mg/dL), BILD: direct bilirubin (mg/dL), CRE: creatinine (mg/dL). Significant differences (p < 0.05) with the control group are highlighted witha. (B) MRI analysis of animals grafted with FATLH. Representative images of the implantation site and different vital organs are shown at 1 week and 12 weeks. The graft site is surrounded with circles; yellow arrows: satellite lymph nodes; L, liver; K, kidney; S, spleen. Scale bar: 2 cm.

