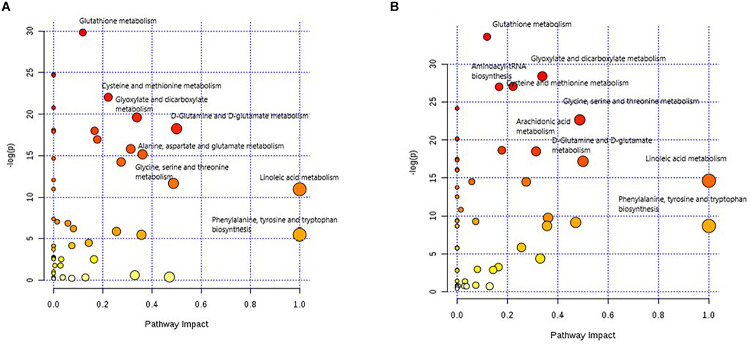
FIGURE 5.
Metabolome view of pathway impact analysis obtained from differential metabolites in PTC (A) and differential metabolites in MNG (B). The color and size of each circle is based on p-values (yellow: higher p-values and red: lower p-values) and pathway impact values (the larger the circle the higher the impact score) calculated from the topological analysis, respectively. Pathways were considered significantly enriched if p < 0.05, impact 0.1 and number of metabolite hits in the pathway >1. PTC; papillary thyroid carcinoma, MNG; multinodular goiter.

