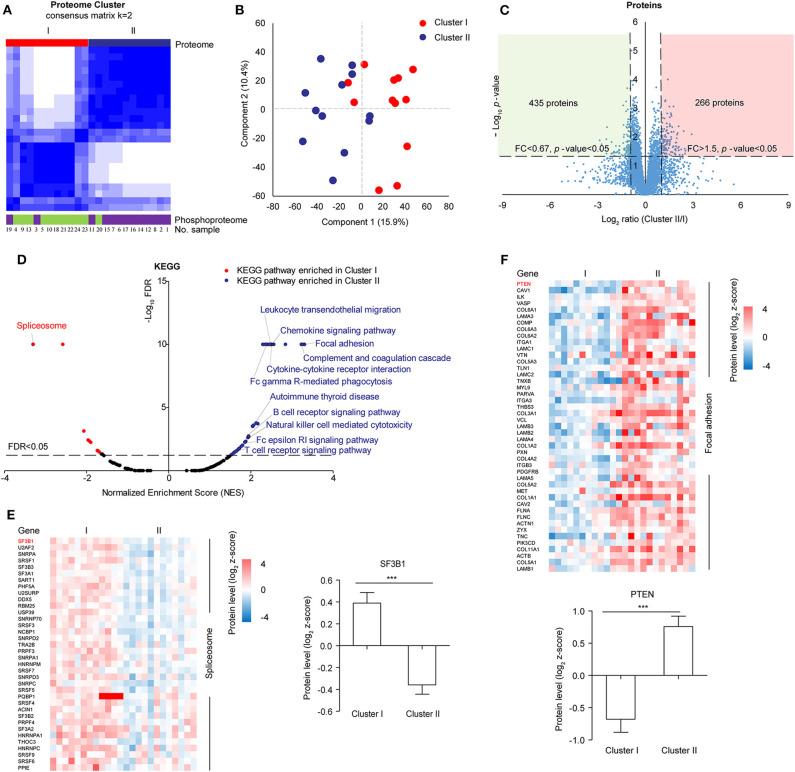
Figure 2.
Proteomic clustering of LUSC. (A) Consensus-clustering analysis of proteomic profiling using the top 1,000 most varied proteins with no missing values within twenty-four tumors. Consensus-clustering analysis of phosphomic profiling using the top 1,000 most varied phosphoproteins with missing values <20% within twenty-four tumors. (B) Principal Component Analysis (PCA) of two proteomic clusters. Red represented Cluster I, and blue represented Cluster II. (C) Scatter plot depicting the fold change of protein abundance comparing cluster II with cluster I. Log2 fold changes were shown on the x-axis and –log10 p-values were shown on the y-axis. The vertical dashed lines indicated fold change > 1.5 and the horizontal dashed line indicated p-value < 0.05 (t-test). (D) GSEA analysis of proteomic data between cluster I and cluster II. The scatter plot showed the enriched KEGG pathways from the Molecular Signatures Database (MSigDB). Normalized enrichment score (NES) was shown on the x-axis and -log10 FDR was shown on the y-axis. The horizontal dashed line indicated FDR < 0.05. The labeled pathways were the most significant pathways or pathways consistent with previous data reported in samples from Western countries. (E) Differential protein expression of cluster I and cluster II in spliceosome. (F) Differential protein expression of cluster I and cluster II in focal adhesion.

