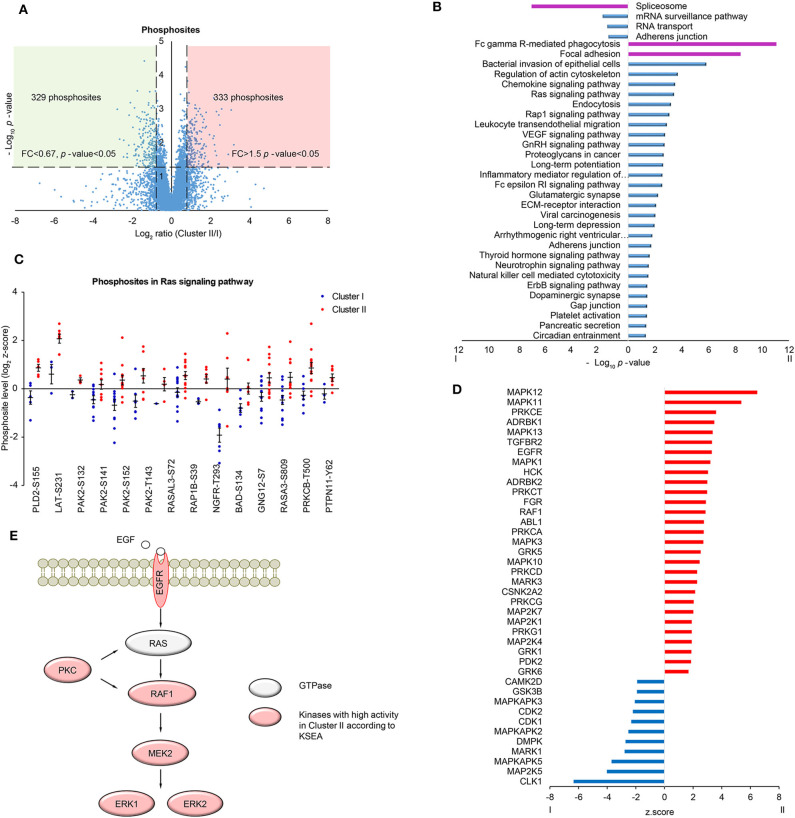
Figure 3.
Phosphoproteomic analysis of LUSC comparing cluster I with cluster II. (A) Scatter plot depicting the fold change in phosphosites comparing cluster II with cluster I. Log2 fold changes were shown on the x-axis and -log10 p-values are shown on the y-axis. The vertical dashed lines indicated fold change > 1.5 and the horizontal dashed line indicated p-value < 0.05 (t-test). (B) DAVID analysis of phosphoproteomic data between cluster I and cluster II (p-value < 0.05). The bar chart showed the enriched KEGG pathways of the differential phosphoproteins between cluster I and II (fold change > 1.5, p-value < 0.05). The highlighted pathways were consistent with those enriched in protein level (purple). (C) The quantification of phosphosites in Ras signaling pathway. Data were presented as dot plot with mean ± SEM. (D) Kinase-substrate enrichment analysis (KSEA) based on PhosphoSitePlus and NetworKIN database. Color blue/red for visual annotation of kinases that reached statistical significance (p-value < 0.05). (E) A scheme showing the enriched kinases in the MAPK pathway.

