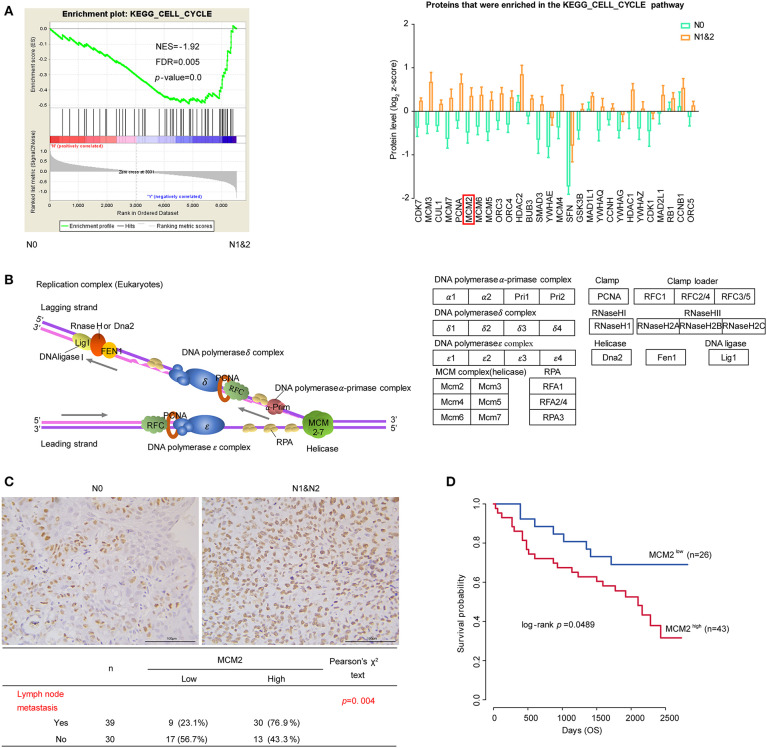
Figure 5.
Cell cycle and DNA replication in LUSC based on LNM. (A) Cell cycle pathway and proteins that were enriched in the pathway. The protein quantifications are presented as mean ± SEM. (B) The diagram of DNA replication in cell cycle. Different protein complexes are represented in different colors. (C) The relationship MCM2 protein expression and LNM in tissue microarray (TMA) assay. (D) MCM2 expression and survival analysis in tissue microarray (TMA) assay. Chi-square test was adopted for the correlation analysis, and Kaplan–Meier plot (Log-rank test) was adopted to describe overall survival (OS) analysis.

