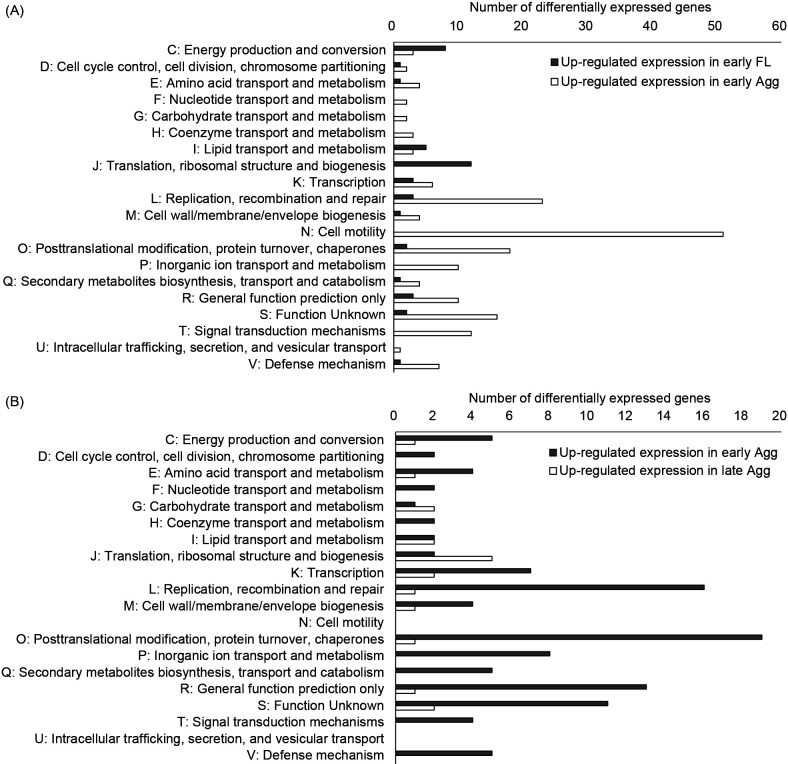
Fig. 3.
Clusters of Orthologous Groups (COG) classification of expression variable genes.
COG assignment of differentially expressed genes (DEGs). Gene expression between the two groups was compared. DEGs were indicated by |log2FC|>1, P<0.05, and a false discovery rate (FDR) <0.05. (A) DEGs in the comparison of early FL and early Agg. Black bars indicate genes up-regulated in early FL. Gray bars indicate genes up-regulated by early Agg. (B) DEGs in the comparison of early Agg and late Agg. The black bar denotes genes whose expression was increased by early Agg. The gray bar denotes genes whose expression was increased by late Agg.

