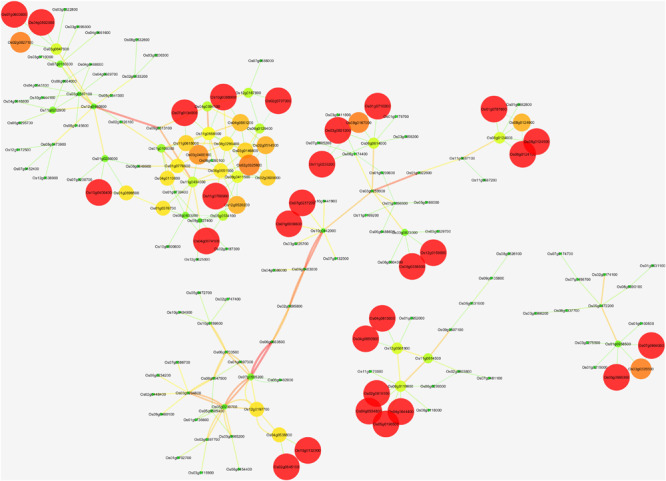
FIGURE 2.

The network of Osa-miR156j target gene; Os01g0922600, Os06g0663500, Os07g0505200, Os09g0507100, Os02g0174100, and Os09g0513100, their potential co-expressed target genes using Cytoscape 3.2.1 software. Visualization parameters were based on the clustering coefficient with low values to the small size of the nodes.
