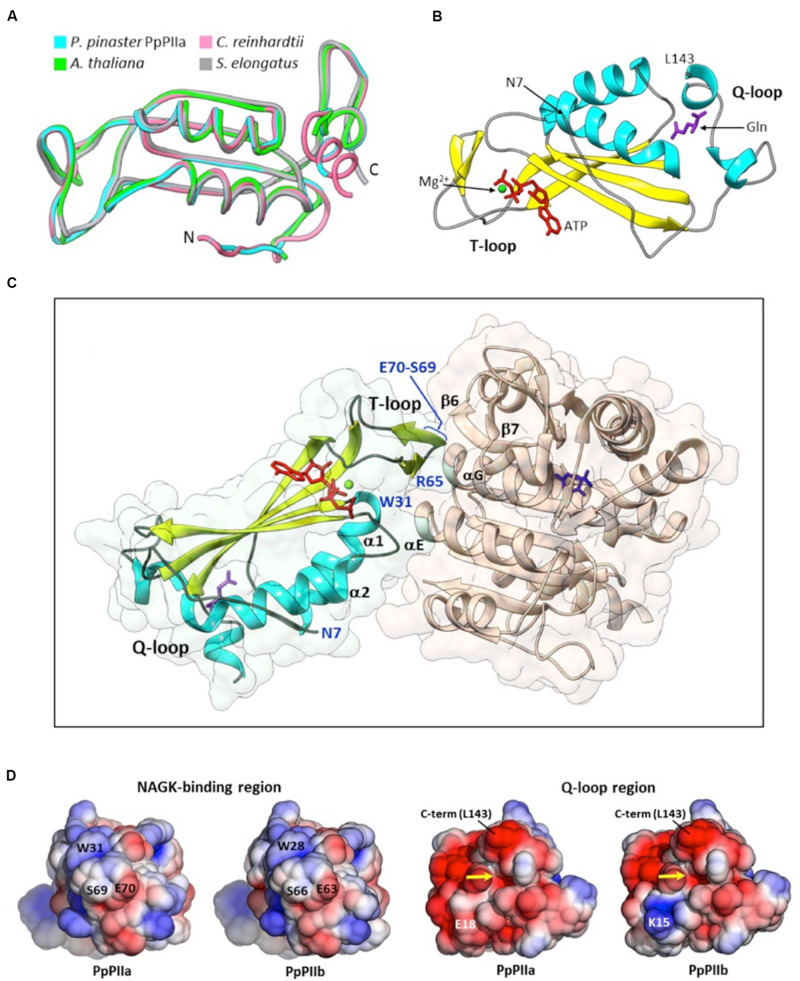
FIGURE 3.
Model structures for PpPIIa and PpPIIb. (A) Structural alignment of modeled PpPIIa and the experimentally solved structures for AtPII (PDB entry 2RD5), SePII (PDB entry 2V5H), and CrPII (PDB entry 4USJ), three homologous proteins crystallized in complex with NAGK and various ligands. (B) Cartoon representation of PpPIIa, highlighting the position of the N-terminal extension, the T-loop and the Q-loop. The position of L143 (PpPIIa numbering; C-terminal end of the model) is also indicated. Docked ligands: Mg2+ (green), ATP (red), and glutamine (purple). Compared to (A), this view is rotated about 90° upward. (C) Side view of a dimer between PpPIIa and/**/NAGK from A. thaliana (PDB code 2RD5). The PII residues directly involved in interactions with the Arabidopsis enzyme are highlighted in blue, like the N-terminus of the model (N7). A molecule of N-acetylglutamate is shown at the active site of AtNAGK (dark blue). (D) Electrostatic potential distribution mapped to the solvent-accessible surfaces of PIIa and PIIb at two opposed ends: the region for NAGK binding (left pair) and the confluence of the N-terminal extension and the Q-loop (right pair). The glutamine-binding site is indicated by a yellow arrow. The potential is shown as a colored gradient from red (acidic) at -2.5 kT/e to blue (basic) at 2.5 kT/e (where k is Boltzmann’s constant, T is temperature, and e is the charge on an electron).

