
FIGURE 1.
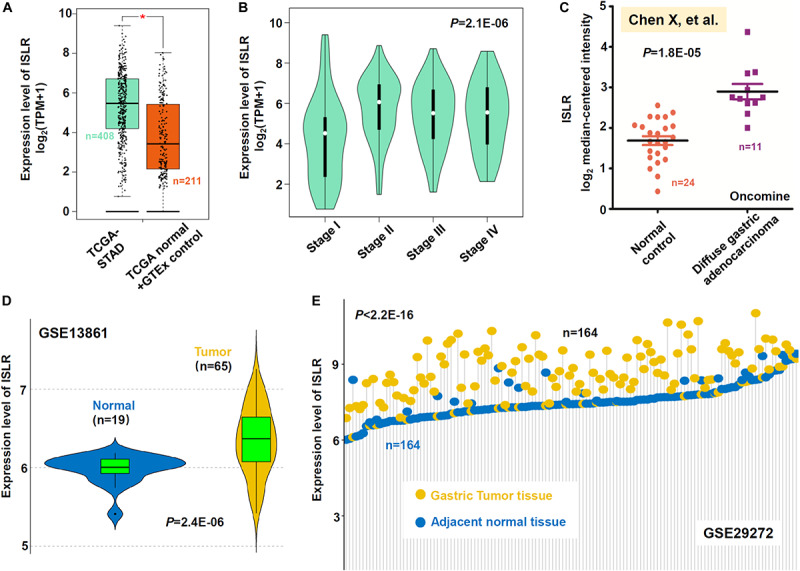
Expression analysis of the ISLR gene between gastric cancer and negative control samples. (A) Expression level of ISLR between gastric cancer tissues in the TCGA-STAD cohort (n = 408) and control tissues (n = 211). Normal tissues in both the TCGA and GTEx databases were included as negative controls. *P < 0.05. (B) The expression level of ISLR among different pathologic stages (stage I, II, III, and IV) was also analyzed through GEPIA2. We also compared the expression level of ISLR between diffuse gastric adenocarcinoma cases and normal controls from the studies of “Chen et al. (2003)” through the Oncomine database (C). The differences in ISLR gene expression between gastric cancer cases and normal controls in GSE13861 (D) and GSE29272 (E) were analyzed as well. Violin plots were used for GSE13861. Adjacent normal tissues were used for GSE29272, and the data were visualized by a dot plot.