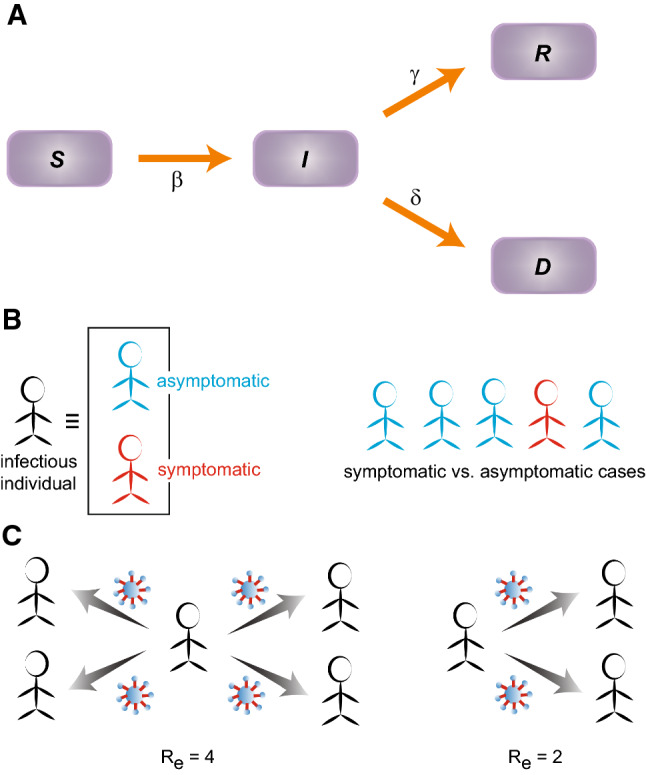
Fig. 1.

The transmission schematic representing the SIRD model. (a) The arrows indicate the flow between the populations of susceptible (S), infected (I), recovered (R), dead (D). (b) Infected individuals can be classified into two categories: symptomatic and asymptomatic. As per the WHO and the Indian Council of Medical Research (ICMR), India, the asymptomatic cases appears to be about 80% compared to the 20% that are symptomatic cases. (c) Effective reproduction number (): The average number of new infections transmitted by a single infectious person. For example, means one person is infecting 4 others on the average. Smaller the value of , lesser the transmission capacity of the infection
