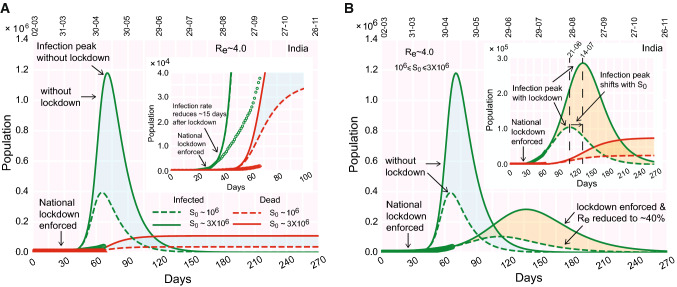
Fig. 2.
Evolution of the COVID-19 and effect of lockdown in India’s context. (a) Time progression of the infection growth curve, if no lockdown is imposed. (inset) The infection growth (as observed from the real data, points) reduces 20 days after the national lockdown is implemented deviating from the theoretical curve with no lockdown (dashed line). (b) Time evolution of the infected population (and deaths, inset), when containment measures (lockdown) are enforced. The color shades enveloping the curves denote the variation in susceptible population (‘cyan’ shades: without lockdown, ‘orange’ shades: with lockdown). The real data considered for fitting are from March 2, 2020 (color figure online)

