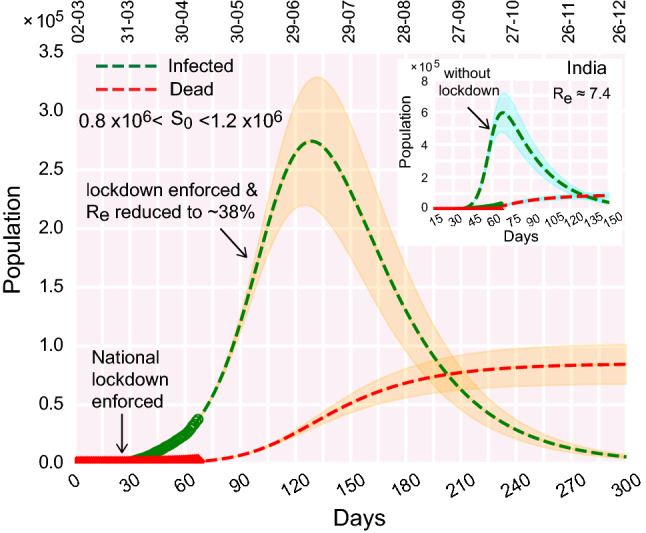
Fig. 4.

Best fit of the infection and death curves with the real data freely varying the effective which appears to be 7.4 in the early stage. The color shades enveloping the curves denote variation in susceptible population within a range of 0.8–. The real data considered for fitting are from March 2, 2020. Relevant parameters for the analysis are , , , days, days,
