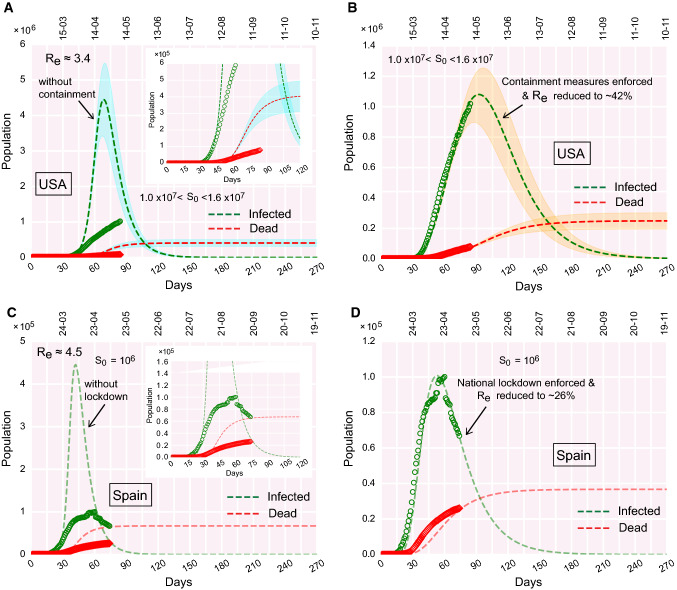
Fig. 8.
COVID-19 progression in the USA and Spain. (a)–(b) Time evolution of the population of infected and dead for the USA, (a) if containment measures were not undertaken, (b) due to the effect of containment measures implemented. Since for the USA, the infection peak is yet to occur, the estimation of the peak value is predictive, and thereby, sensitive to relevant parameter choices. Hence, the susceptible pool () for the USA is varied, to obtain an average estimation of the peak value. The smeared color shades enveloping the dashed curves denote the variation in in the context of the USA. (c)–(d) Time evolution of the population of infected and dead for Spain, (c) if containment measures were not undertaken, (d) due to the effect of containment measures implemented. The real data considered for fitting are from February 15, 2020, for the USA. For Spain, real data are considered from February 24

