
Fig. 2.
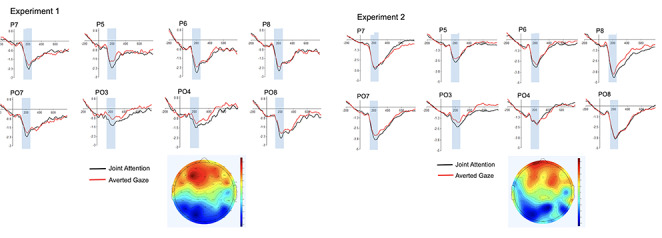
Experiment 1 (n = 35; left panel) and Experiment 2 (n = 34; right panel) grand averaged ERPs showing the effect of gaze response at 170–230 ms after gaze shift (shaded area). The scalp maps show the gaze response effects, calculated as the mean amplitude (in μV) for the incongruent, averted gaze response subtracted from the mean amplitude for the congruent, joint attention gaze response.