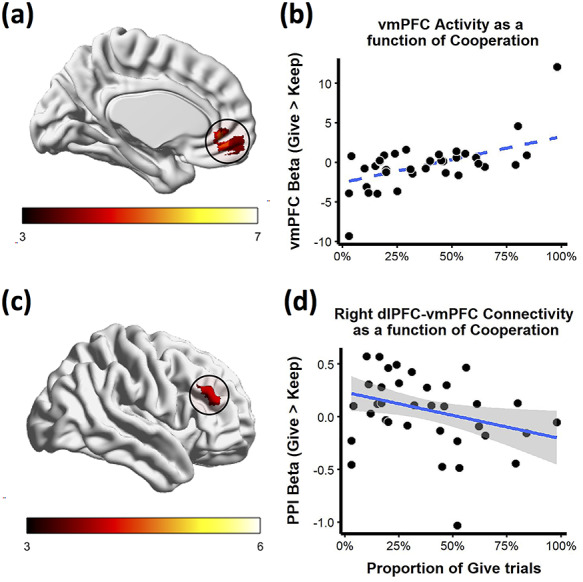
Fig. 2.

vmPFC activity and dlPFC-vmPFC connectivity is moderated by prosocial tendencies. Average cooperation moderates (a) BOLD response in vmPFC and (c) right dlPFC activity during Give (vs Keep) decisions. Color indicates magnitude of t statistic. As an alternate visualization, (b) vmPFC cluster betas (y-axis) for each participant (n = 35) are plotted against the proportion of cooperative trials (x-axis). (d) Right dlPFC-vmPFC PPI cluster betas (y-axis) are plotted against the proportion of cooperative trials (x-axis). Robust linear regression fits are displayed with blue lines and surrounding 95% confidence interval band.
