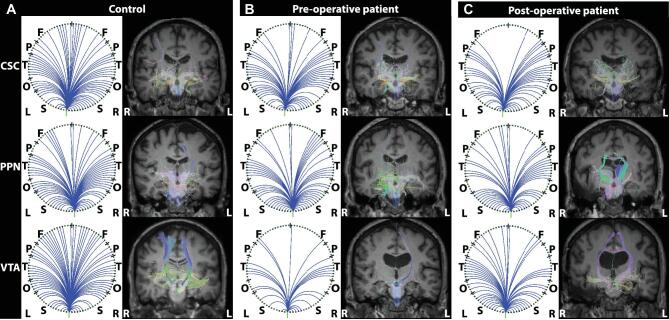
Figure 5.
Example ARAS structural connectivity. Diffusion tractography seeded from CSC (top row), PPN (middle row), and VTA (bottom row) in an example matched control A, preoperative patient B, and the same patient postoperative C for each region. Figures are generated using the BrainSuite Diffusion Pipeline (BDP; http://brainsuite.org). On the left in each column A-C are circle graphs that summarize projections seeded from ARAS regions to cortical and subcortical regions in BrainSuite SVReg Atlas. On the right in each column A-C are estimated diffusion tensors overlaid onto T1-weighted coronal anatomical images using a rigid mutual information-based registration. Overall, for the 3 ARAS seed regions, the most tracts are seen in the controls A compared to patients B and C. Additionally, visually, there are no differences in estimated tracts between preoperative patients B and postoperative patients C. BrainSuite settings: 1 seed per voxel, step-size = 0.25 mm, maximum steps = 500, angle-threshold = 10°, fractional anisotropy threshold = 0.05, orientation distribution function sampling = 20, and generalized fraction anisotropy/lambda 2 threshold = 0.01. CSC, cuneiform/subcuneiform nuclei; F, frontal; L, left; O, occipital; P, parietal; PPN, pedunculopontine nucleus; R, right; S, subcortical; T, temporal; VTA, ventral tegmental area.

