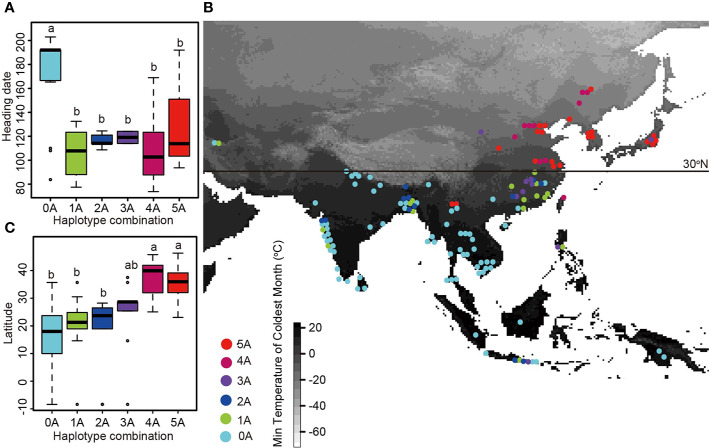
Figure 3.
The geographical distribution of haplotype combinations and the relationship between haplotype combination and heading date. (A) Boxplots of heading dates for samples with different haplotype combinations of five long-day suppressor genes. Haplotype combinations containing between zero and five group A haplotypes are shown on the x-axis. (B) Geographical distribution of haplotype combinations of five long-day suppressor genes. Haplotype combinations containing between zero and five group A haplotypes are indicated by dots of different colors. The map is shaded to indicate the minimum temperature of the coldest month, with lower minimum temperatures in white and higher minimum temperatures in black. (C) Boxplots of latitude data for samples with different haplotype combinations of five long-day suppressor genes.

