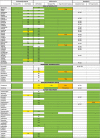
Table 2C.
Pharmacokinetic interactions related to hydroxychloroquine, azithromycin and remdesivir.
 |
 : No data available or degree of interaction not measurable.
 : 1 < AUC ratio ≤ 1.4 (DDI Predictor), No interaction expected (Drugs Information Database, HIV Drugs Interaction, Theriaque).
 : Potential Weak Interaction (HIV Drug Interaction), Minor Interaction (Drugs Information Database), To be taken into account or precaution for use (Theriaque), 1.5 ≤ AUC ratio ≤ 1.9 (DDI Predictor).
 : Potential Interaction (HIV Drug Interaction), Moderate Interaction (Drugs Information Database), Avoid association (Theriaque), 2 ≤ AUC Ratio ≤ 9.9 (DDI) or 0.4 < AUC Ratio AUC < 0.6 (DDI Predictor).
AUC Ratio = area under the substrate concentration in blood or plasma over the dosing interval at a steady-state/AUC of the substrate given with an inhibitor an inducer.
▲ Increase of lopinavir/ritonavir concentration.
▾ Decrease of lopinavir/ritonavir concentration.
