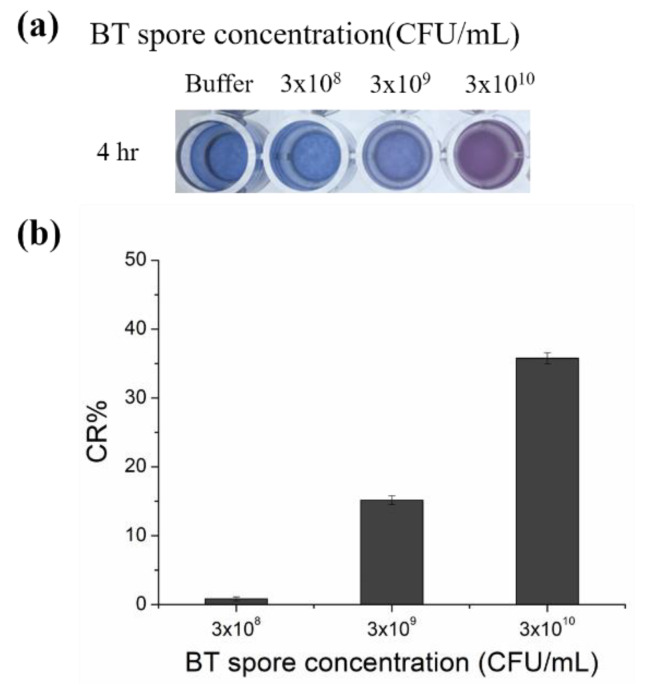
Figure 2.
PDA-aptamer liposomes incubated with different concentrations of spore solutions. (a) Image of PDA-aptamer liposomes after 4 h of incubation in PBS (pH = 7.5, 5 mM) and spore solutions at different concentrations. (b) Color response percentage (CR%) of the PDA-aptamer liposomes after 4 h of incubation in spore solutions of different concentrations. Color response data are presented as the mean ± SD (n = 3).

